

What Is Incrementality Testing?


Incrementality testing is a controlled experiment that measures the additional business a marketing activity generates. It compares outcomes between a treatment group exposed to the marketing and a control group that is not. The difference in results represents the incremental lift, revealing the true impact of marketing spend rather than relying on platform-reported figures.
This guide explains how to measure incrementality, compares the main test methods, and shows how test results feed into a marketing mix model to guide the next budget decision: where to add spend, where to hold, and where to cut.
Why Incrementality Testing Matters
Incrementality testing matters because it shows what a marketing activity caused, so budget decisions rest on evidence rather than platform-reported credit. It answers three questions in sequence: what did the marketing cause, what was it worth, and what should we do next?
As a core form of marketing experimentation, incrementality testing helps you understand:
- The channels that are genuinely driving growth
- The incremental customer acquisition cost (CAC) and incremental return on ad spend (ROAS)
- The campaigns worth scaling
- How much incremental revenue your marketing generates
- How you can cut costs without compromising meaningful growth
These insights are crucial for real-time budget optimization , scenario planning, and forecasting as budgets become more constrained.
Gartner's 2026 CMO Spend Survey found that marketing budgets were 7.8% of company revenue in 2026, up only slightly from 7.7% in 2025 (respondents were mostly companies with $1 billion or more in revenue). With budgets that flat, every channel has to show what it adds, and incrementality testing is one way to produce that evidence.
Who Should Run Incrementality Tests?
Teams should run incrementality tests when a budget decision depends on the outcome and the channel can be tested reliably. The first condition concerns value; the second, feasibility.
When a Test Is Worth Running
A test is justified when the potential cost of an incorrect decision exceeds the cost of the test. This typically applies in the following situations:
- The channel represents a significant portion of the budget, so misallocation would be more costly than the test itself.
- Platform reports indicate strong results, but it is unclear how many conversions are directly attributable to the ads.
- Multiple channels or platforms claim credit for the same conversions.
- You plan to scale up or reduce a channel and require stronger evidence before proceeding.
- Finance or leadership requests proof of incremental return.
- You use MMM and need experimental results for calibration.
Spend increases the importance of a decision but does not determine test feasibility. A smaller channel may justify testing if the decision is high-stakes, while a large channel may not require testing if the outcome would not affect your actions.
When a Channel Is Ready to Test
Four criteria determine whether a test can provide a usable answer. Each replaces a judgment call with a measurable or verifiable standard.
| A decision depends on it | The result would change an action, such as scaling, cutting, or reallocating spend | Write down what you would do for a high, a low, and a zero result. If the action is the same in all three, skip the test. |
|---|---|---|
| A meaningful lift | The smallest lift that would change your decision, usually the break-even point | Break-even incremental ROAS = 1 ÷ gross margin. At a 40% margin, a channel must return at least $2.50 of incremental revenue per $1 of spend to cover its cost. |
| Enough data | Enough conversions, or enough markets and weeks, to detect that lift reliably. The usual standard is 80% power at 5% significance. | Run a power analysis before launch. The smaller the lift, the more data it needs: detecting an effect half the size takes roughly four times the sample. |
| A credible control | A control group that behaves like the treatment group before launch and stays unexposed during the test | Run an A/A check on the pre-launch period. If the groups differ by more than normal random variation, or their trends diverge before launch, the control is not credible. |
Data requirements increase rapidly as you seek to detect smaller differences. For example, detecting a difference between a 2.0% and 1.5% conversion rate at 80% power and 5% significance requires about 10,800 shoppers per group. Detecting a difference between 2.0% and 1.75% requires about 46,000 per group, and detecting a difference between 2.0% and 1.9% requires about 300,000. If a small lift would not affect your decision, you do not need to detect it, which helps keep the test affordable.
These figures apply to audience-level tests comparing conversion rates between two groups. For geo tests, which compare markets over time, the sample size depends on the number of markets and weeks, and a power analysis on historical data is used instead. If analysis shows the test cannot detect a meaningful lift, you can increase the spend change, extend the test duration, or select a different method. The limitations section addresses cases where testing is not practical.
How to Measure Incrementality
You measure incrementality by comparing the conversion rate of a treatment group with a control group, then expressing the gap as a share of the treatment group's conversions.
Incrementality = (Test conversion rate − Control conversion rate) ÷ Test conversion rate
Consider a hypothetical scenario:
An online fashion retailer wants to measure the impact of a paid advertising campaign.
Marketers randomly divide 80,000 shoppers into two groups: 40,000 see the ads, while the other 40,000 do not.
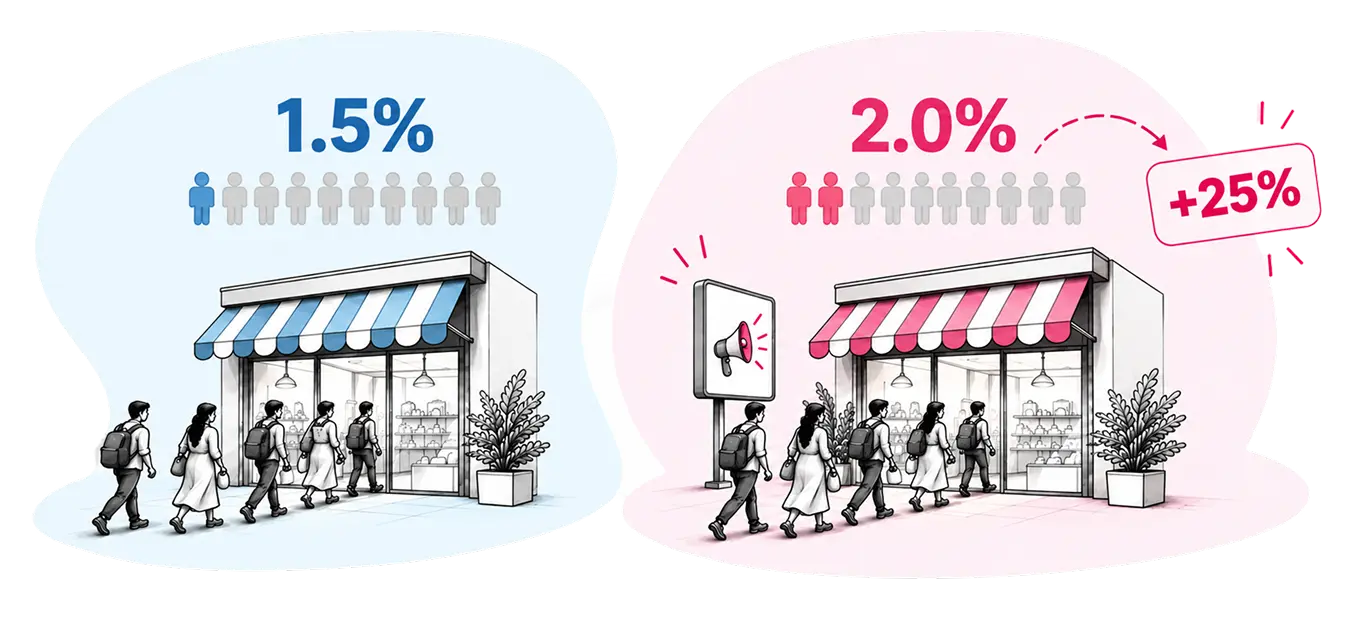
Marketers then track the purchases from both groups:
| Metrics | Treatment group | Control group |
|---|---|---|
| Shoppers | 40,000 | 40,000 |
| Orders placed | 800 | 600 |
| Conversion rate | 2% (800 ÷ 40,000 × 100) | 1.5% (600 ÷ 40,000 × 100) |
Applying the incrementality formula:
Incrementality = (2% − 1.5%) ÷ 2% = 0.25
Multiplying 0.25 by 100 gives 25%, which means:
- 25% of the treatment group's orders were incremental
- 75% of the orders would have occurred without the campaign
Another often-reported metric is incremental lift, which shows the result relative to the control group. Here’s the formula: (Test conversion rate − Control conversion rate) ÷ Control conversion rate, or (2.0% − 1.5%) ÷ 1.5% = 33.3%.
Both figures represent the same 200 extra orders. These orders are 25% of the treatment group’s 800 and 33.3% more than the control group’s 600. Always check which metric a report is quoting.
With 40,000 shoppers per group, this gap is statistically significant. Much smaller groups could show the same rates without the result being reliable.
Key Terms in Incrementality Testing
- Counterfactual
- The outcome that would have occurred without the marketing activity. Incrementality testing uses a control group or another method to estimate this outcome.
- Treatment group
- The group that receives the marketing activity being tested. Its results are compared with a control or holdout group.
- Control group
- A group that does not receive the marketing activity being tested. It provides a baseline for estimating what would have happened without the marketing.
- Holdout group
- A group deliberately excluded from a marketing activity so its results can be compared with those of the treatment group. "Holdout" and "control" are often used interchangeably in incrementality testing.
- Incremental lift
- The additional conversions, revenue, or other outcomes caused by the marketing activity, compared with the control group's results. It is usually expressed as a percentage of the control group's result.
- Incrementality (percentage)
- The share of the treatment group's conversions that the marketing caused, calculated as (test rate − control rate) ÷ test rate.
- Incremental ROAS (iROAS)
- Incremental revenue divided by ad spend, counting only the revenue the test shows the marketing caused.
- Minimum detectable effect (MDE)
- The smallest lift a test is designed to detect reliably. A smaller MDE generally requires more data or a longer test.
- Statistical power
- The likelihood that a test will detect a real effect when one exists. A test with low power misses meaningful lift.
- Synthetic control
- A weighted combination of untreated markets that mirrors the test market’s pre-launch performance. Use this method when campaigns run in limited markets or when no single market closely matches the test market.
- Confidence interval
- A range that shows the uncertainty around an estimated result. A narrower interval generally means greater precision.
- Response curve
- A curve showing how outcomes change as spend rises. It flattens at the point where additional spend returns less, known as diminishing returns.
What Are the Main Types of Incrementality Tests?
The main types of incrementality tests are geo holdout (geo-lift) tests, Go Dark with Pacing, randomized audience holdouts, switchback tests, PSA and ghost-ad tests, and regression discontinuity. Every type follows the same logic: a treatment group receives the marketing, a control or holdout group does not, and the difference in outcomes estimates incremental lift.
Randomization is often the strongest way to create comparable groups, but it is not always practical. Marketers also use matched markets, synthetic controls, or other methods to create a credible comparison.
No method is universally best. Choose the approach that fits the marketing activity and gives you the strongest practical counterfactual.
Geo Holdout / Geo-Lift Tests
A geo incrementality test divides geographic markets into treatment and control groups. The marketing activity runs in the treatment markets and is withheld or reduced in the control markets. The results are then compared.
This works well for channels that can be controlled geographically, including CTV, direct mail, and some paid media.
Go Dark with Pacing
Go Dark with Pacing is LiftLab’s own named geo-based test design for mapping a channel’s saturation curve. Here, “Going dark” means pausing a channel’s delivery in a set of test markets, while “Pacing” means deliberately running the channel at different spend levels across markets, rather than simply switching it on or off. This ensures that rather than only confirming that a channel works, it shows where returns begin to flatten, so teams can set always-on spend at the level where marginal return matches the rest of the media mix. The saturation points feed back into Agile MMM. In one anonymized example, delivery was paused across a randomized set of markets for the full 42-day flight while spend elsewhere continued at its normal pace. See the full example in Does Incrementality Testing Work?
Conversion Lift / Randomized Audience Holdout
Audience holdout tests divide the target audience randomly into two statistically similar groups.
The treatment group receives the marketing while the control group is held out. Meta incrementality testing, such as Meta's Conversion Lift, is one example.
Switchback Tests
Switchback tests alternate treatment and control conditions across different time periods. They work well when marketing can be switched on and off, but user-level or geographic holdouts are difficult.
The design needs to account for seasonality, time-based effects, and carryover between periods.
PSA vs. Ghost Ads
PSA tests show control users an unrelated public service announcement instead of the brand's ad. This creates a control group, but the PSA costs money to serve and may reach a different set of users than the brand's advertising would have.
Ghost ads take a different approach. The platform identifies control users who would have been served the brand's ad and flags them as the control group without actually showing them the ad. This avoids the cost and audience mismatch of PSAs, but requires platform support.
Both approaches create a control condition that helps estimate the incremental impact of advertising.
Regression Discontinuity (Brand Search)
Regression discontinuity is used when marketing exposure changes around a defined threshold. In brand search, this provides a way to estimate incremental impact.
The method depends on strong assumptions about how treatment is assigned, so the design needs careful evaluation.
How Methods Compare
| Method | Best for | Suitable channels | Duration | Reliability depends on |
|---|---|---|---|---|
| Geo holdout / geo-lift | Geographic campaigns | Connected TV (CTV), paid search, display, retail media, direct mail | 6-8 weeks | How well markets are matched |
| Go Dark with Pacing | Estimating lift and the diminishing-returns curve to find the optimal always-on spend | Paid media channels where delivery can be paused by market (anonymized example: Meta Awareness) | 6-8 weeks (42 days in the anonymized example) | Market matching and sample size |
| Randomized audience holdout | Addressable digital audiences | Paid social, retail media, display, paid search | Often several weeks | How well groups are randomized |
| Switchback | Time-controlled campaigns | National TV, affiliates, Influencers, concentrated regional markets | Depends on campaign cycle | Test design |
| PSA / ghost ads | Limited holdout options | Paid social, display, video, programmatic advertising , Influencers, concentrated regional markets | Depends on campaign volume | Control quality |
| Regression discontinuity | Credible treatment thresholds | Paid search, promotions, campaigns with eligibility or exposure thresholds | Depends on data | Whether assumptions hold |
| Post-purchase surveys | Complementary customer-reported context | Retail media, paid social, CTV, direct mail, and other channels | Ongoing, low-effort | Not experimental; supporting signal only |
Incrementality Testing vs. Attribution
Attribution and incrementality testing answer different questions, so they can produce very different views of the same marketing activity.
| What it is | What it measures | Why it falls short | What to use alongside | |
|---|---|---|---|---|
| Attribution | Rules or models that assign conversion credit to touchpoints | Which touchpoints are associated with a conversion | Click-based credit can go to customers already likely to buy, and platforms can each claim the same conversion | A controlled test for incremental conversions, revenue, CAC, or ROAS |
| Incrementality testing | A controlled experiment with treatment and control groups | Additional outcomes caused by the marketing | Needs enough volume and a clean control, and covers one activity in one period | Attribution for day-to-day reporting, MMM for allocation across channels |
Attribution asks: Which marketing touchpoints are associated with a conversion?
Incrementality testing asks: Would those conversions have happened without the marketing?
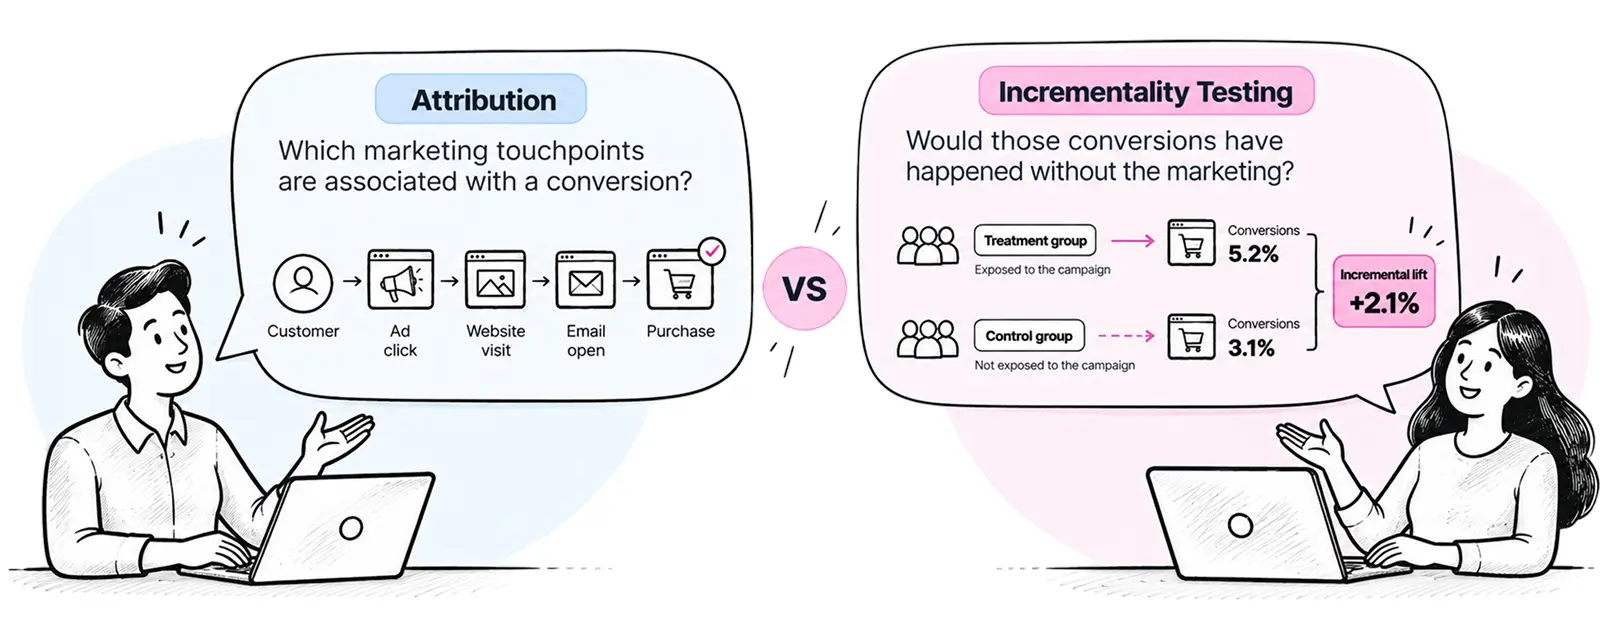
Attribution helps you understand the customer journey and where conversions are reported.
But the way attribution works can affect how much credit a channel receives. Click-based models, for example, may give substantial credit to an ad because a customer clicked it before purchasing, even if that customer was already likely to buy.
Walled gardens (closed digital platforms controlled by their providers) create a measurement challenge. Platforms have detailed visibility into activity within their own environments but limited visibility into what happens across other channels. As a result, multiple platforms can claim credit for the same customer or conversion.
Incrementality approaches the question differently. By comparing a treatment group with a control or holdout group, it estimates how outcomes would differ without marketing.
Using both can give marketers a more complete picture.
Incrementality Testing vs. A/B Testing
Incrementality tests and A/B tests both use controlled comparisons, but they are applied to different marketing questions.
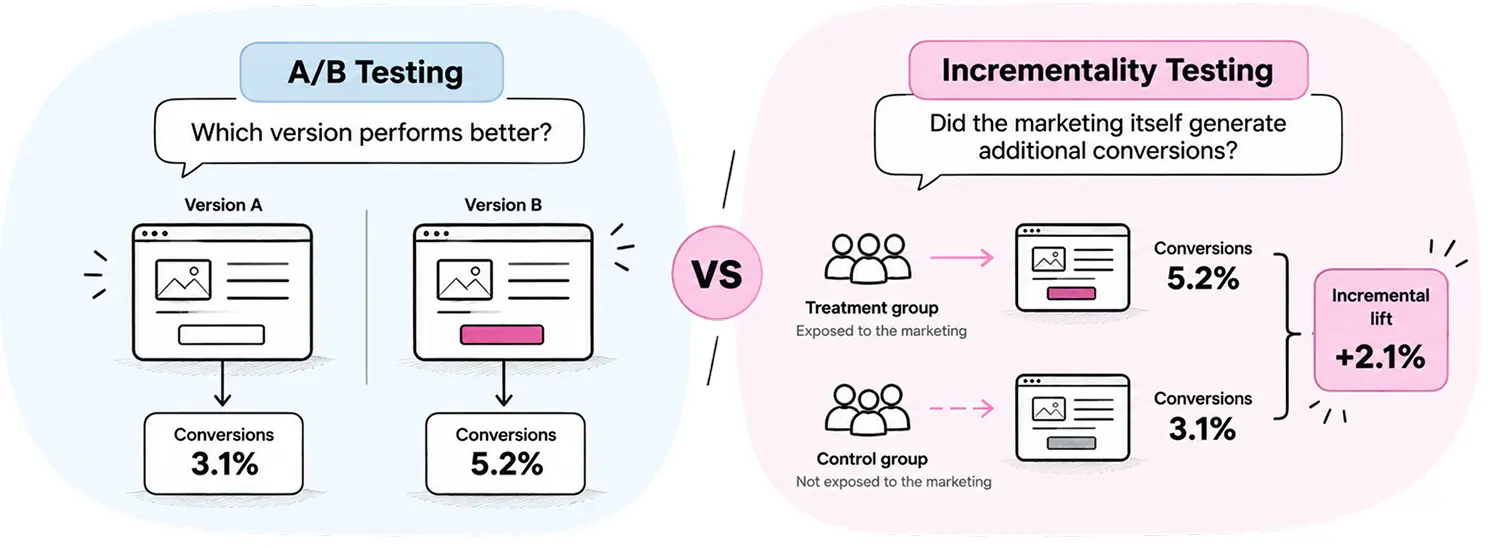
An A/B test compares two versions of an experience to see which performs better. For example, a marketing team might test two landing pages, offers, or creative variations and measure which produces more conversions.
An incrementality test compares a marketing treatment with a control condition to determine whether the marketing itself caused additional business. In structure, it is an A/B test in which one arm receives no marketing.
The distinction matters because in a typical A/B test, both groups see marketing. The test shows which version performs better, but without an unexposed group it cannot show how many conversions either version added. The winning variant may still be taking credit for conversions that would have happened anyway.
Incrementality tests are therefore particularly useful for budget and channel decisions. A team can use the result to estimate incremental conversions, revenue, CAC, or ROAS and decide whether a marketing activity is worth scaling.
The two approaches work together: an A/B test helps optimize how a campaign runs, and an incrementality test shows whether it creates additional business.
How to Run an Incrementality Test
To run a reliable incrementality test, work through these seven steps in order.
Determine the Business Question
Start by determining what you want to learn and which business decision the results will inform. Identify the outcome you will measure, such as incremental conversions, revenue, or profit, and decide what results would justify continuing or scaling the marketing activity.
Test One Variable at a Time
Run separate tests for each variable, whether it is a creative, a channel, or a campaign. If you're testing multiple variables, it becomes difficult to tell which one drove the outcome.
Choose the Right Testing Method
The incrementality method you choose depends on your business question and campaign design. For instance, geo-based incrementality testing measures campaign impact by running the campaign in select markets, withholding it in comparable ones, and comparing the outcomes.
Randomized audience holdout may be suitable to test if a catalog or an email generates additional purchases.
Select a Suitable Channel
Start with a channel where the result could change your budget or strategy. Consider whether the channel can be isolated, whether you can create a credible treatment and control group, and whether you have enough conversion or revenue data to measure a meaningful effect.
If you already use an MMM, identify channels with the widest uncertainty ranges in its estimates. Testing these channels provides the most valuable insights and is preferable to selecting channels based solely on ease of testing.
LiftLab incorporates this approach into its process. Agile MMM pinpoints channels with the highest measurement uncertainty, ensuring experiments target areas where they most effectively reduce planning risk.
Here's a quick guide on pairing the channel with a suitable incrementality testing method:
- Paid social: Use audience holdouts or conversion-lift studies to compare people who see ads with similar people who do not.
- Retail media: Audience or geographic tests help find out whether ads generate additional purchases, beyond sales that would have happened anyway.
- Connected TV: Geo-lift tests compare sales or conversions in areas exposed to ads with those in control areas.
- Direct mail: Withhold mail from a selected audience or geographic area and compare its results with those that receive it.
- Paid search and display: Use audience or geographic holdouts to measure whether ads generate additional conversions rather than simply taking credit for existing demand.
- Audio and other addressable media: Compare exposed audiences with a suitable control group to estimate the additional results generated by the campaign.
Define Your Sample Size and Test Power
Your test needs enough observations to detect the lift you care about. Define the minimum detectable effect (MDE) before the test begins. If the expected effect is small, you will generally need more data to distinguish it from normal variation.
Set Your Test Duration
Run the test for 4-6 weeks to capture sufficient observations and account for normal fluctuations in demand. Consider seasonality, campaign cycles, and any lag between marketing exposure and conversion. Ending a test too early can produce an inconclusive result.
Keep Your Control Groups Uncontaminated
Your control group needs to remain genuinely unexposed to the marketing activity being tested. If people in the control group encounter the campaign through another channel or market, the difference between treatment and control can shrink and make the marketing appear less incremental than it is.
Throughout the test, monitor for unexpected changes that could affect the comparison. If the control group is contaminated or the test conditions change materially, document it before interpreting the result.
The goal is to create a credible counterfactual: a reliable estimate of what would have happened without the marketing. That is what makes the resulting lift useful for business decisions.
Learn how to prove marketing's incremental impact and turn causal insights into finance-approved decisions.
Read our blog: The CMO's Incrementality Testing Playbook: Causal Proof That Finance Will Actually Act On
Incrementality Testing Limitations
Incrementality testing provides strong evidence of marketing impact, but it is not equally practical for every campaign or channel.
Low-traffic markets can make tests difficult because there may not be enough observations to detect a meaningful lift. A test can also take longer when conversions are infrequent, or the expected effect is small.
Offline channels can be harder to isolate. Linear TV, radio, out-of-home, and other broad-reach activities may reach people outside the intended treatment area, making it harder to maintain a clean control group.
One-off campaigns present another challenge. If a campaign runs only briefly, there may not be enough time or data to establish a reliable counterfactual. Seasonal effects, promotions, and other changes happening at the same time can also affect the result.
Control-group contamination. If people in the control group are exposed to the marketing through another route, the difference between treatment and control can shrink, making the campaign appear less incremental than it really is.
Finally, a statistically significant result is not automatically a useful business result. The measured lift needs to be large enough to matter relative to the cost of the marketing and the decision you are trying to make.
For example, if a campaign costs $100,000 and a large test confirms it generates 500 additional orders with statistical significance, each earning $50 in profit, the total profit is $25,000. Although the lift is real, it does not cover the campaign cost. In contrast, achieving the same 500 extra orders from a $10,000 campaign would be worthwhile.
You can manage each limitation by matching the test design to the marketing activity, available data, and business question.
Common Incrementality Testing Mistakes and How to Prevent Them
A well-designed incrementality test can still mislead if the setup or interpretation goes wrong. The table below lists common mistakes and how to prevent them.
| Common mistake | What the problem is | How to prevent it |
|---|---|---|
| No clear business decision | The test produces data without informing a meaningful decision. | Define the question and decision before testing. |
| Poorly matched control group | Existing differences between groups distort results. | Match groups on historical performance and trends. |
| Underpowered test | The test cannot reliably detect the expected effect. | Define the MDE and required sample size in advance. |
| Control contamination | Control groups see the marketing being tested, reducing measured lift. | Prevent control-group exposure to the tested marketing. |
| Stopping too early | Early results may be unstable or misleading. | Set the test duration in advance and collect sufficient data. |
| Focusing only on lift percentage | Higher lift does not necessarily mean higher profit. | Compare incremental revenue, CAC, or ROAS with marketing costs. |
| Treating one test as conclusive | Results may not hold across campaigns or markets. | Repeat tests across campaigns, markets, or time periods. |
The best tests are designed around the decision they need to support and not simply around the data that happens to be available.
How Incrementality Testing Fits into a Full-Funnel MMM
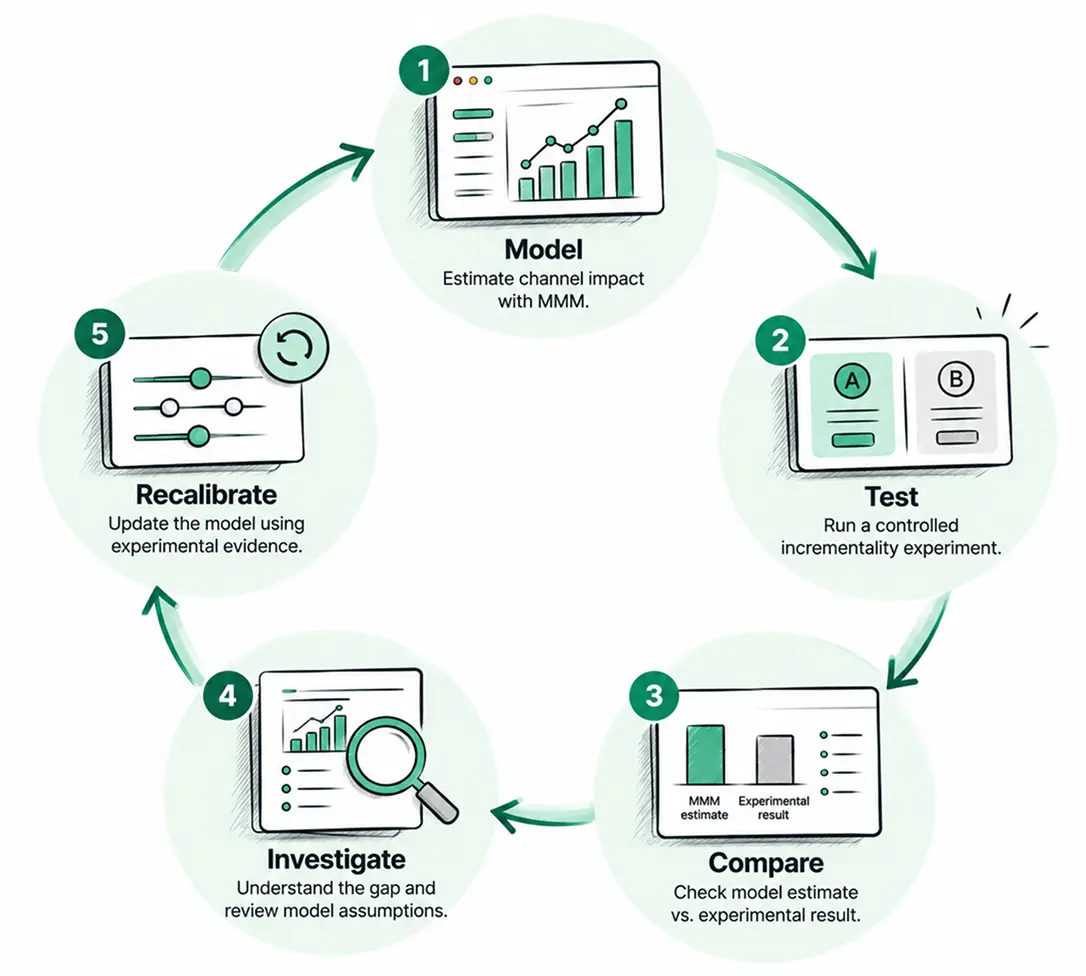
Incrementality testing serves as the calibration signal in a full-funnel MMM. Experiments show whether the model's estimate of a channel's contribution matches what a controlled test measures, and the results recalibrates the model.
Full-funnel MMM estimates the contribution of marketing channels and other business factors across markets and over time. It evaluates the impact of marketing activities across the customer journey, from top-of-funnel to bottom-of-funnel interactions.
Incrementality testing measures the causal impact of a specific marketing activity using a controlled experiment.
In other words, MMM answers questions like “How do I allocate marketing budget across 10 channels?”, while incrementality testing answers tactical questions like “Did this specific marketing activity generate additional sales?”
The team compares the model's estimate with the incremental result from a controlled experiment covering the same activity and period. If the results differ materially, the gap signals an opportunity to investigate.
For example, if an MMM estimates $1.5 million in incremental revenue from a channel but a well-designed experiment suggests $1 million, the test provides evidence that the model's estimate may need adjustment. Repeated experiments provide stronger evidence and help keep the model grounded in observed marketing behavior.
This differs from backtesting, where a model checks its past predictions against itself. Calibration with experiments uses independent results from controlled tests, so the model is corrected by evidence it did not generate.
Testing across both brand and performance activity gives teams a stronger view of the full funnel rather than concentrating evidence only where attribution is easiest.
Brand activity matters most for this check, because its effects build slowly and is easy to under-credit in short-term conversion data. In The Long and the Short of It (2013), Les Binet and Peter Field analyzed IPA Effectiveness Databank cases and found the most effective budgets split roughly 60% to brand building and 40% to sales activation. The IPA's later Effectiveness in Context report shows the best mix varies by brand type, so the ratio works as a benchmark.
LiftLab's Long-Term Value of Ads (LVA) quantifies the longer-term effect of advertising alongside its immediate return.
See the result: how a Go Dark with Pacing test corrected a consumer brand's MMM estimates in opposite directions.
Why a Single Lift Number Is Not Enough
A single lift number shows what happened in one test. It changes a budget only when you feed the result back into a model that guides allocation. Without that step, each test answers one question and then sits in a report.
Using Incrementality Testing and MMM to Improve Budget Decision
Ultimately, the purpose of combining incrementality testing and MMM is to make better budget decisions.
For example, suppose an experiment shows that a channel's incremental ROAS is lower than its reported performance. We see this in the FY 2025 Category Benchmark Report, where home brands in LiftLab’s U.S. client dataset raised spend by roughly 15% year on year, while iROAS fell 7%. Revenue still grew 7%, but each additional dollar returned less, and the report suggests some of that spend landed where returns were already diminishing. A response curve calibrated with experiments can show where that point is before you spend.
MMM can also put these findings in the context of the wider media mix, helping the team assess the implications of shifting budget to other channels. That creates a practical feedback loop: MMM identifies where to investigate, experiments provide evidence, and those results improve future allocation decisions.
Over time, this creates compounding value. Each credible experiment can improve the measurement system, helping guide the next budget decision and making the next experiment more useful.
Evaluate MMM platforms with the right questions.
Read the blog: Marketing Mix Modeling Platform: 7 Questions Every Omnichannel Brand Should Ask
Does Incrementality Testing Work?
Incrementality testing can provide strong evidence that a marketing activity caused additional business, but the result needs to be interpreted in context.
A credible test can show that a treatment group performed differently from a comparable control group and estimate the resulting incremental lift. That gives marketers evidence about causal impact, rather than relying only on attributed conversions.
The strength of the conclusion depends on the test's quality. A well-designed experiment with adequate sample size, a credible control group, and appropriate duration can provide strong evidence. A poorly designed test can produce an estimate that looks precise but does not support a reliable business conclusion.
Incrementality testing also does not prove that the same result will apply everywhere. A test measures the effect of a particular activity under particular conditions. Results can change with audience, geography, creative, spend level, season, or market conditions.

Example: A Meta Awareness Test That Corrected an Agile MMM in Opposite Directions
In one anonymized Meta incrementality test, a consumer brand wanted a causal check on what its marketing mix model said about Meta Awareness, a long-running part of its always-on mix. LiftLab ran a 42-day Go Dark with Pacing test: Meta Awareness delivery was paused across a randomized set of markets while spend elsewhere continued at its normal pace, and retail revenue and e-commerce revenue were measured as two separate outcomes.
Observed incremental ROAS (iROAS) was 1.56 for retail, 7.5% higher than the model's estimate, and 1.64 for e-commerce, 18.5% lower. The model needed correcting on both outcomes, in opposite directions, and the gaps became the signal for recalibrating it.
The test estimated the additional revenue generated as Meta Awareness spend increased, noting that each added dollar yields diminishing returns. It identified the spend level where an extra dollar on Meta Awareness would produce the same return as an extra dollar elsewhere in the media mix. For retail, this level was about $1,069 per day, and for e-commerce, about $1,101 per day, compared to $648 per day during the test. At these levels, the estimates suggest approximately $538K (retail) and $574K (e-commerce) in annual incremental revenue, totaling about $1.1 million. These are modeled estimates and do not reflect the brand's actual results.
| Outcome | Observed iROAS | vs. model estimate | Current daily spend | Model-implied optimal daily spend | Annual incremental revenue at optimal spend |
|---|---|---|---|---|---|
| Retail | 1.56 | 7.5% higher | $648 | $1,069 | ~$538K |
| E-commerce | 1.64 | 18.5% lower | $648 | $1,101 | ~$574K |
Source: anonymized customer experiment. Annual figures are modeled at the optimal spend point.
A model's estimate stays a forecast until a controlled test checks it, and the check can move it in either direction.
Example: A Google Brand Search Test That Saved $14,000 a Day
An international SaaS company was spending heavily on Google brand search and was unsure whether it was overspending or had room to increase spend. LiftLab ran a geo-based experiment at three spend levels: regular spending, reduced spending, and doubled spending. It then fitted a diminishing-returns curve to show the spend level that would maximize profit. The company decreased ad spend for brand search by 87%, saving $14,000 per day of ineffectual spending for the customer while profits went up by 3.5%
Discover how a Google branded search experiment helped a SaaS company boost profit and curb ad spend.
Read the full success story.
That is why repeated testing matters: each new test adds evidence you can compare over time and use alongside MMM.
How to Choose an Incrementality Testing Platform
Choose an incrementality testing platform by checking it against the eight criteria below. For enterprise incrementality measurement, look for a solution that fits your channels, data, team, and measurement needs.
| Criterion | What to Look For |
|---|---|
| Test design | Methods and control structures suited to your marketing channels |
| Data requirements | Clear requirements for the data needed to run credible tests |
| Statistical rigor | Transparent approach to statistical power, uncertainty, lift, and test validity |
| Channel coverage | Support for the channels and marketing activities you need to test |
| Measurement integration | Ability to use experiment results alongside MMM and other measurement approaches |
| Repeatability | A practical way to run tests regularly rather than as one-off projects |
| Decision support | Results that translate into useful budget and strategy decisions |
| Usability | A level of complexity that matches your team's expertise and resources |
You should also consider how much of the process you want to manage internally. Building incrementality measurement in-house can provide flexibility, but it may require specialist expertise, engineering resources, statistical design, and ongoing maintenance.
An incrementality testing platform can make sense when you want a repeatable testing program without building the entire measurement workflow yourself. The important question is whether a solution can produce credible, actionable evidence at the scale and frequency your business needs, not whether it has the longest feature list.
Evaluate potential solutions against a real business question, not just a feature checklist. Ask how the solution would design the test, handle your available data, communicate uncertainty, and turn the result into a decision.
How LiftLab Approaches Incrementality Testing
LiftLab treats incrementality testing as part of a broader measurement system, not as a standalone exercise that ends with a lift number.
Its approach connects causal experimentation with Agile Marketing Mix Modeling, so test results improve the model that guides future budget decisions.
The process uses experiments to reduce measurement uncertainty where it matters most and then carry that evidence into the next planning cycle.
The platform's core capabilities include:
- The Incrementality Testing Suite runs controlled experiments. It includes geo-based tests that estimate the additional revenue marketing generates.
- Multiple test designs. The platform supports geo-based methods, switchback tests, and Go Dark with Pacing, depending on the measurement objective. Test design matches the business question instead of using the same method across channels.
- Agile MMM identifies where testing matters most. Agile MMM gives you actionable insights to prioritize just the right experiments by using these four layers:
- Auction Dynamics (The Cost Layer): Separates daily auction dynamics, such as CPM, CPC, and competition, from the effect of marketing on consumer behavior.
- Consumer Response (The Impact Layer): Estimates how advertising influences immediate sales and quantifies longer-term brand equity, distinguishing brand and performance effects.
- PlatformSense (The Speed Layer): Applies live advertising-platform data to robust response curves, providing stable insights. PlatformSense detects daily channel signals.
- The Trust Engine (The Confidence Layer): Uses controlled incrementality experiments to validate and calibrate the model's response curves against real-world results.
The result is a more connected measurement process:
Model → identify uncertainty → run the test → measure causal impact → calibrate the model → make a better budget decision.
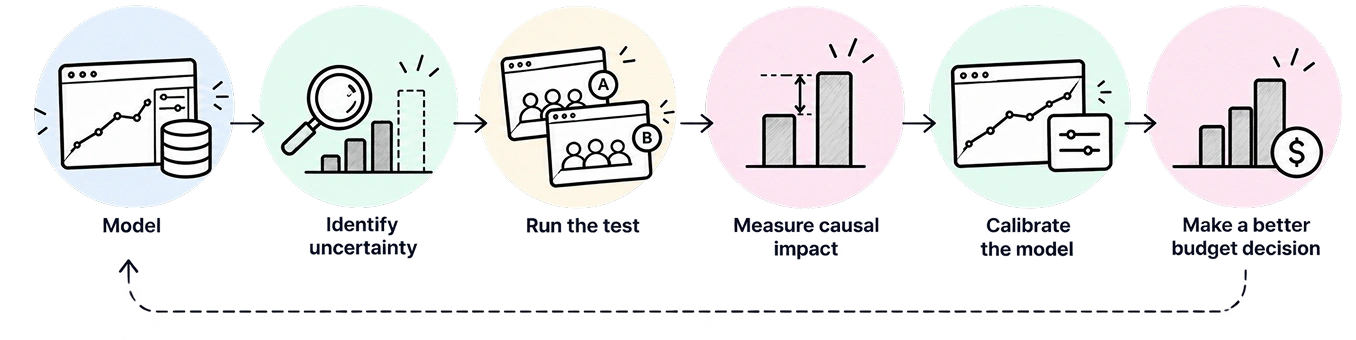
Over time, each credible experiment strengthens the evidence behind the next allocation decision. That is the core of LiftLab's approach: incrementality testing that compounds in value instead of producing a one-time answer.
Design rigorous experiments, measure true incremental impact, and connect test results to better marketing decisions.
Explore the Incrementality Testing Suite →
Frequently Asked Questions about Incrementality Testing
An incrementality test measures the additional conversions, revenue, or other business outcomes caused by a marketing activity. It compares a treatment group that receives the marketing with a comparable control or holdout group that does not. The gap between the two groups is the incremental lift.