Improving dashboards or data quality will not resolve these issues. They stem from measurement systems built for an environment with fewer channels, no retail media, and a functional identity graph, which no longer reflects your current operating landscape.
Six Reasons Your Omnichannel Budget Conversations Keep Stalling
Improving dashboards or data quality will not resolve these issues. They stem from measurement systems built for an environment with fewer channels, no retail media, and a functional identity graph, which no longer reflects your current operating landscape.
01 — Multi Distribution Endpoint
Marketing spend should generate sales across retail, wholesale, direct-to-consumer, third-party marketplaces, and retail media, each with unique unit economics and conversion timelines. For example, an omnichannel brand may see paid social campaigns increase in-store sales, yet attribution models might not reflect this, even as pixel trackers report direct ecommerce sales.
output: posterior_iROAS[channel] + CI_95%, saturation_curve[channel]
02 — Online-to-Offline Attribution Gap
BOFIP (Buy Online, Pick Up In-Store) has become standard. While digital campaigns can drive measurable store visits, current attribution systems have not kept pace. As a result, digital spending that increases foot traffic or in-store conversions is often under-credited. This makes digital media appear less efficient than it truly is and distorts performance measurement.
LiftLab models online-to-offline without in-store pixels
03 — Promotions Contaminate the Signal
Omnichannel retail relies heavily on promotions such as seasonal discounts, retailer trade promotions, and clearance events. If promotional lift is not modeled separately from media, it can lead to over-attribution to campaigns occurring that week. ROI figures that include promotional noise may therefore be misleading.
LiftLab strips promo lift from digital baseline models
04 — Measurement Infrastructure Lag
Over the past three years, CTV, retail media networks such as Amazon DSP, Walmart Connect, and Kroger Precision Marketing, creator partnerships, and in-store digital screens have become significant growth channels. However, most omnichannel MMMs were designed for a five-channel media mix. Today, brands manage more than 13 channels using measurement systems that are no longer adequate.
LiftLab ingests 70+ platform including retail media
05 — Signal Fragmentation
Paid search, paid social, programmatic, retail media, and CRM each report separate attribution. As a result, Finance receives fragmented ROAS claims that do not align with a single revenue line. There is no unified view of how these channels contribute to total omnichannel revenue; there are only competing claims about budget performance.
LiftLab creates one source truth with audit
06 — Privacy Signal Erosion
iOS ATT restrictions have eliminated the mobile identity graph used for cross-device attribution, and cookie deprecation is accelerating. As a result, brands that depend on pixel-based MTA for omnichannel journeys now operate with incomplete data. Many are unaware of the extent of missing information or its impact on channel mix decisions. Budgets previously calibrated with complete data are now based on incomplete signals, which is reflected in CAC.
LiftLab uses no identity graph or user-level tracking
Most omnichannel brands are running legacy MMM, platform self-reporting, and MTA simultaneously. Each has a different story. None account for the full omnichannel picture. And they can’t be reconciled.
Legacy MMM Consultancies
(Nielsen, Analytic Partners, Ipsos MMA)
Ad Platform Self-Reporting
(Google, Meta, TikTok, Amazon Ads)
Multi-Touch Attribution (MTA)
(GA4, Adobe, Northbeam, Triple Whale)
A single, weekly-updated model provides consistent data for both your CMO's campaign planning and your CFO's budget approval. It uses the same numbers and methodology across all your channels, not just those tracked digitally.
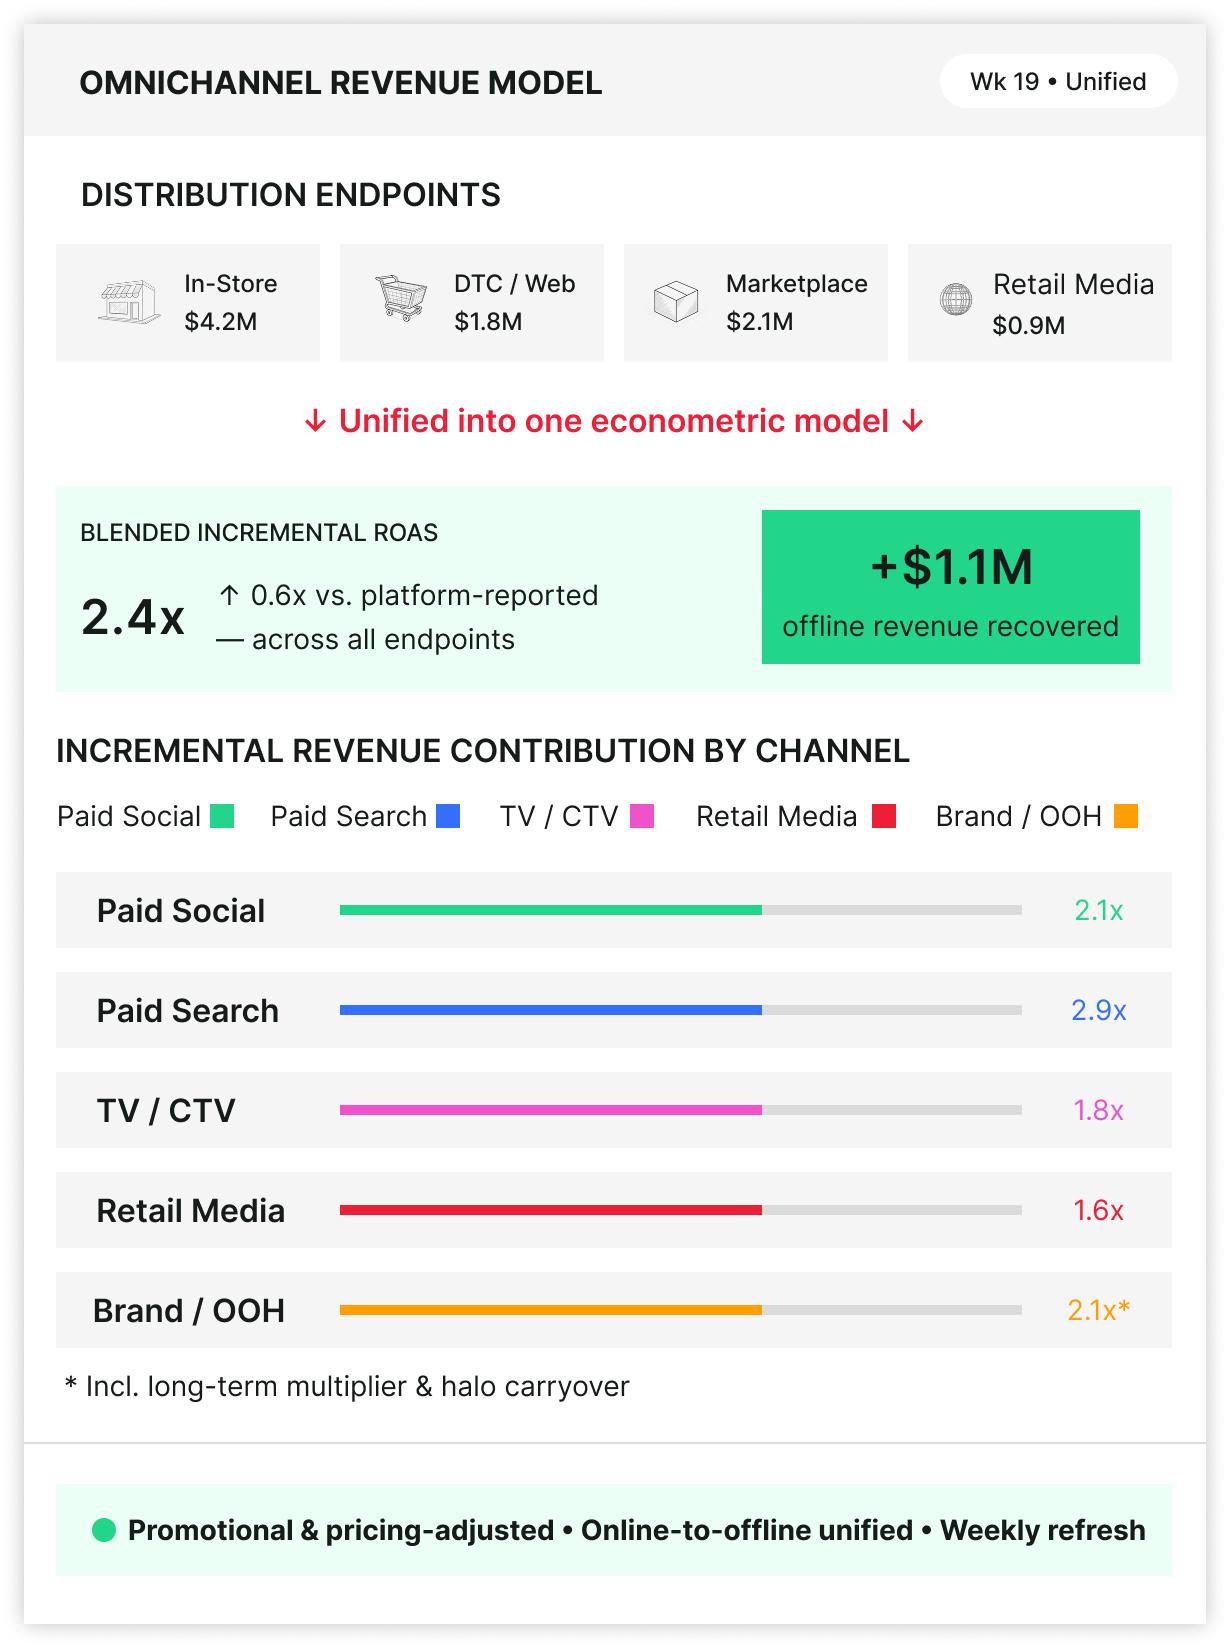
LiftLab’s two-stage Agile MMM consolidates spend, outcomes, and business-context signals such as pricing, promotions, seasonality, and offline store data from all distribution channels into a unified econometric model. For the first time, the impact of paid social on in-store revenue is measured alongside its direct-to-consumer results, with accurate promotional lift decomposition to ensure Finance can rely on the data.
Explore Agile MMM →The Trust Engine™ feeds causal proof from transparent incrementality testing directly back into the Agile MMM as calibration inputs. For omnichannel brands, this means geo experiments that separate in-store lift from digital conversion are continuously sharpening channel response curves. Every test cycle, the model gets more accurate. Every budget decision compounds on better evidence than the last.
See Incrementality + Calibration →PlatformSense collects daily data from over 70 ad platforms and applies real-time signals to stable econometric response curves. It detects CPM shifts, creative fatigue, and auction volatility within 24 hours, rather than 90 days. For omnichannel brands with frequent promotions and seasonal events, this enables in-flight reallocation decisions based on current data rather than outdated models.
Explore PlatformSense →The Scenario Planner builds constraint-aware budget scenarios that respect pre-committed TV contracts, channel caps, CAC ceilings, and locked media agreements, producing outcome ranges with explicit trade-offs. Marketing and Finance align on the same numbers before a dollar is committed. The budget meeting becomes a decision, not a negotiation between competing channel dashboards.
Explore Scenario Planner →Six purpose-built tools, each addressing a specific measurement failure that omnichannel brands experience. Connected into one compounding system — not six separate workstreams.
Align Marketing and Finance with a unified, constraint-aware budget plan that covers all distribution channels. Enter your actual guardrails, such as pre-committed TV, channel caps, and CAC ceilings, to generate a mathematically sound allocation plan that both teams can implement without revisiting the spreadsheet.
Explore Full-Funnel Budget Planning →
Do not rely on average ROAS for optimization. LiftLab identifies where each channel’s returns level off at your current spend, rather than using outdated data. For omnichannel brands, this analysis accounts for retail media saturation, in-store promotional effects, and cross-channel diminishing returns that blended ROAS often conceals.
Explore Diminishing Returns →
Geo holdout tests are structured to address omnichannel complexity by capturing in-store lift, marketplace halo, and DTC incrementality within a single experiment. Each result is integrated into the Agile MMM via the Trust Engine™, continuously refining response curves. This closed-loop approach offers a level of insight that standalone incrementality vendors cannot match.
Explore Incrementality & Calibration →
“What happens to total omnichannel revenue if we shift 15% from paid search to retail media?” LiftLab provides constraint-aware forecasts to answer this question. The Conserve, Maintain, and Accelerate scenarios are presented in terms of revenue outcome ranges and CAC delta, using the same metrics your CFO applies to other capital investments.
Explore Scenario Planning & Forecasting →
24 hour from platform shift to updated budget recommendation — not 90 days. PlatformSense ingests 70+ platforms including Amazon Ads, Walmart Connect, and all major paid social and search channels. When a promotional window opens or a channel saturates mid-flight, the signal reaches you before the quarter’s P&L already reflects the missed opportunity.
Explore Real-Time Budget Optimization →
For omnichannel brands, the compounding effect of brand advertising on future CAC and customer lifetime value is often the most under-measured asset in the marketing P&L. LiftLab calibrates long-term advertising multipliers to your brand and category, integrating them into scenario planning so brand investment is supported by financial evidence rather than intuition.
Explore Long-Term Brand Value Measurement →