- Why LiftLab
- Platform
Platform Overview
One source of truth for growth decisions
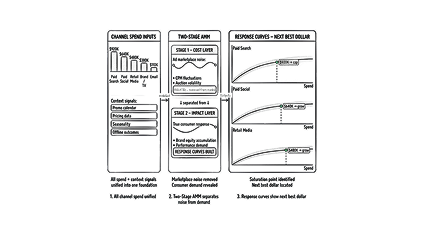
Agile Marketing Mix Modeling
Know where the next dollar goes
Incrementality Testing Suite
Turn experiments into board-ready narratives
Scenario Planner
Pressure-test growth plans before spending
PlatformSense
Volatility Alerts and Rapid Reallocation
Miles AI
Ask the question. Get the answer
- Solutions
BY USE CASE
Full Funnel Budget Planning
Align every dollar to revenue outcomes
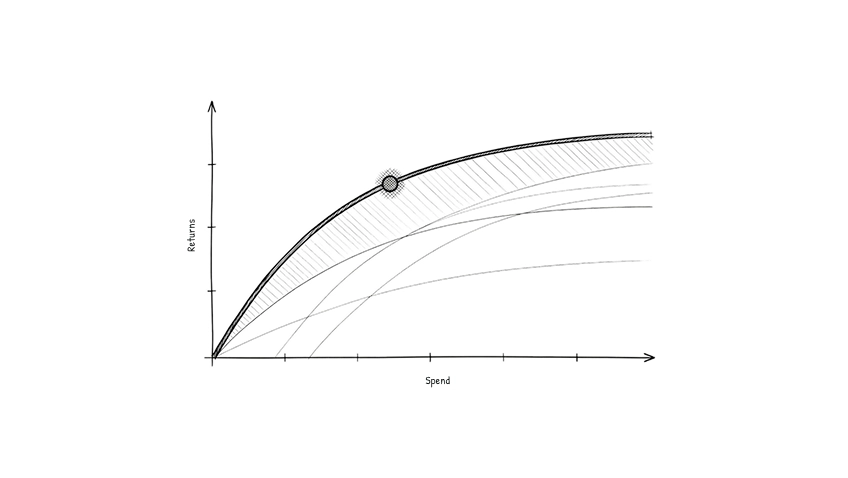
Marginal ROI & Diminishing Returns
Find diminishing returns before you overspend
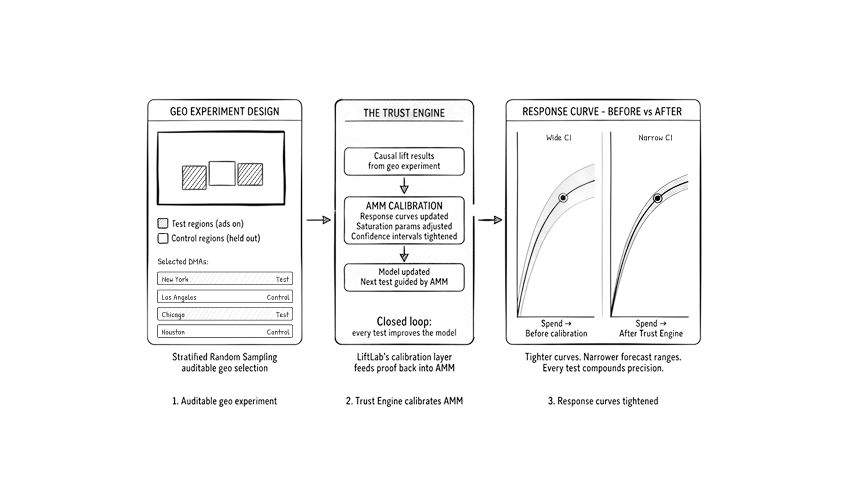
Incrementality & Calibration
Know what’s driving growth, for real
Scenario Planning & Forecasting
Turn what-ifs into confident board answers
Real-Time Budget Optimization
Daily signals. Defensible moves
LT Brand Value Measurement
Make every brand dollar visible on the P&L
BY PERSONA
- Resources
Knowledge Hub
Every insight to grow smarter and faster
Blogs
Sharper takes on measurement and growth
Success Stories
Real brands, real budget wins
Webinars
Expert-led sessions on spend, ROI, and growth
Whitepapers
Research-backed frameworks for modern marketers
Benchmark Report
Industry data to sharpen your spend decisions
Measurement Conversations
CEO insights and expert conversations
FAQs
Straight answers on MMM and measurement
- About