Liftlab - Logo
Request a Demo

Trusted by the Category Leaders Who've Outgrown Their Dashboards

From global consumer brands to high-growth DTC, LiftLab is the measurement system for CMOs and CFOs. They choose LiftLab when platform attribution no longer suffices. 

DTC → Multichannel

3.4x TikTok at Max Profit

eComm Grocery / CPG

13 channels weekly

Global Retail + DTC

+9.5% revenue

Consumer software

+19% gross revenue

Entertainment

7 → 13 channels

Six Reasons Your Growth Is Outpacing Your Measurement.

Your measurement approach is not incorrect; rather, you are using tools designed for a single-channel environment in a multi-channel landscape. These are not data issues but architectural shortcomings.

Six Reasons Your Growth Is Outpacing Your Measurement.

Your measurement approach is not incorrect; rather, you are using tools designed for a single-channel environment in a multi-channel landscape. These are not data issues but architectural shortcomings.

01 — DTC-to-Retail Transition

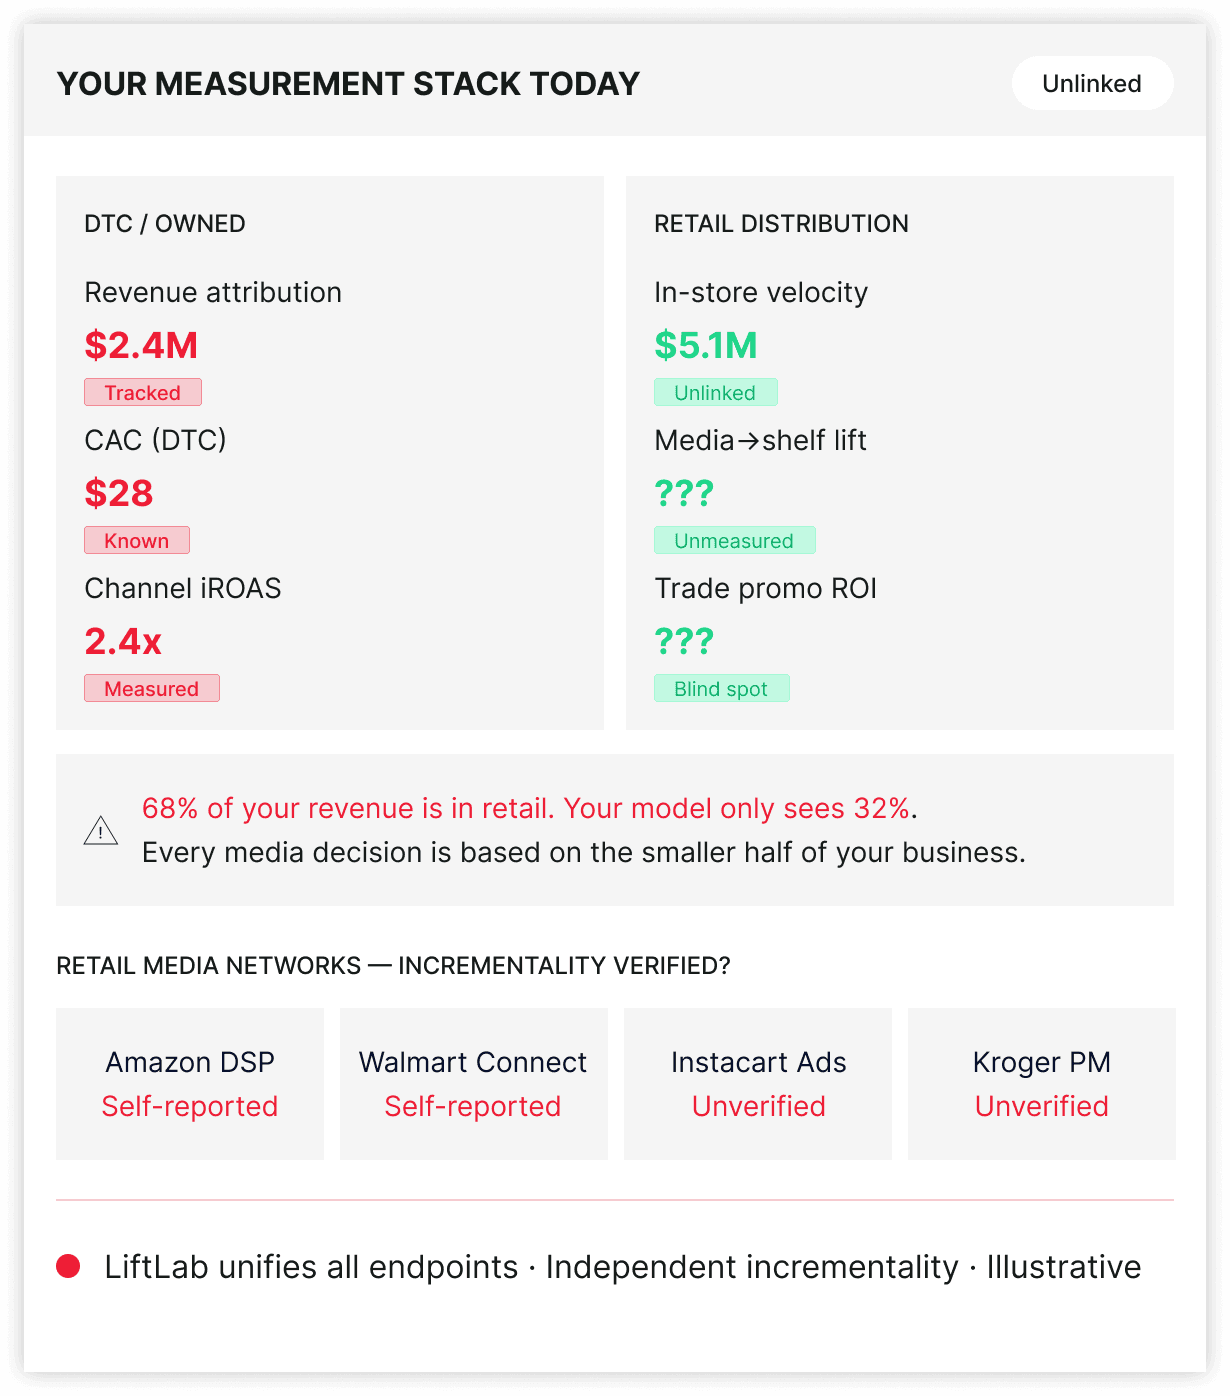
The moment you enter retail, your measurement system breaks in half

DTC analytics, including pixel-based, first-party, and direct attribution, become ineffective once a product is sold through retail channels. While your Meta advertising spend increases Walmart sales, your attribution model does not capture this impact. As a result, media allocation decisions are based only on the 32% of your business that is measurable, while the remaining 68% in retail relies on intuition and trade promotions.

LiftLab unifies DTC revenue and retail velocity in one model

02 — Retail Media Void

 You’re on 4 retail media networks. None of them agree on what’s incremental.

Amazon DSP, Walmart Connect, Instacart Ads, and Kroger Precision Marketing each use different attribution windows and definitions, but all aim to report high ROAS. According to the ANA, 71% of advertisers identify incrementality as their top RMN KPI, yet only a few have a closed-loop system to accurately measure it. As a result, joint business plans are negotiated using data that lacks full credibility.

Trust Engine™ proves retail media incrementality independently

03 — Trade Promo Contamination

Your media ROI may appear inflated because promotions are included in the denominator

Apple's App Tracking Transparency (ATT) framework, introduced with iOS 14.5, removed the mobile IDFA and disrupted cross-device attribution for DTC brands. AppsFlyer, which tracks over 15 billion installs annually, reported that advertisers lost visibility into about 65% of iOS installs after ATT. An independent Harvard Business Review analysis found that e-commerce customer acquisition costs rose by approximately 38% in the 12 months following ATT, with DTC brands among the most affected. DTC brands relying on pixel-based attribution now operate with incomplete data and may not realize how these gaps affect their channel mix decisions.

LiftLab decomposes promotional lift from media-driven incrementality

04 — Long-Term Value Blindspot

New-to-brand household penetration is your most valuable metric, yet most models do not capture it

For challenger brands focused on increasing category share, long-term household acquisition is more important than short-term volume. Traditional volume-optimizing MMM often undervalues brand investment, leading to reduced brand budgets when quarterly results are weak. This reduction consistently increases future customer acquisition costs, yet the model does not account for this effect.

LiftLab measures long-term multipliers alongside short-term volume

05 — PE Board Pressure

Your investors want CAC payback and contribution margin. You’re still showing platform ROAS.

PE-backed and growth-stage CPG brands face financial scrutiny that DTC dashboard metrics cannot address. When quarterly reviews ask for blended customer acquisition costs across all channels or the payback period on incremental media spend, a screenshot from Meta Ads Manager is insufficient. Finance teams require auditable, reliable figures.

LiftLab outputs: CAC payback, contribution margin, revenue outcome ranges

06 — Exploding Channel Mix

Your promotional calendar changes every week. A quarterly MMM report is a post-mortem, not a strategy. 

Challenger CPG brands compete with established incumbents and with one another through frequent promotions, category events, competitor launches, and retail seasonal windows. Relying on a quarterly MMM refresh means decisions are based on data that is at least 60 to 90 days old. eMarketer reports that CPG ad spend growth will slow to 4.6% in 2025, falling below the national average for the first time in three years. In a budget-constrained environment, brands that act on current data gain an advantage, while those waiting for quarterly reports risk losing market share.

LiftLab: weekly model refresh + PlatformSense daily signals · Move before the window closes

Three Stacks. Three Blind Spots.

Legacy CPG syndicated measurement, DTC attribution tools, and retail media self-reporting were each built for a different world. In 2025, challenger CPG brands need all three — and none of them talk to each other.

Failure A

Syndicated CPG MMM

(Nielsen, Circana/IRI, Analytic Partners)

  • Built for P&G and Unilever — irequires years of data and spend levels that challenger brands don’t have yet
  • Scanner data arrives with 4–8 week lag — incompatible with weekly promotional decisions
  • Pricing excludes challenger brands — designed for $1B+ media budgets, not $20–200M high-growth brands
  • Volume optimization only — systematically undervalues new household acquisition and brand equity building
  • No retail media coverage — most frameworks pre-date RMNs as a meaningful CPG spend category

FAILURE B

DTC Attribution Tools

(Triple Whale, Northbeam, GA4, Elevar)

  • Zero coverage of retail distribution — pixel attribution stops at the DTC website; the shelf is invisible
  • iOS ATT broke the identity graph — ~65% iOS install visibility lost post-ATT (AppsFlyer), making DTC attribution structurally incomplete
  • Cannot model trade promotions — the largest CPG marketing spend category is invisible by design
  • No saturation modeling — doesn’t tell you when a channel has peaked; average ROAS masks the flat part of the curve
  • No scenario capability — shows what happened; cannot model what happens if you reallocate $500K from paid social to Amazon DSP

FAILURE C

Retail Media Network Reporting

(Amazon Attribution, Walmart Luminate, Instacart Ads Portal)

  • Every RMN claims the same conversion — Amazon, Walmart, and Instacart all report attribution independently; the overlap is structural
  • Only 6% of advertisers fully trust retailer-reported metrics — the credibility problem is documented, not disputed (Bain & Company)
  • No cross-RMN comparison — each platform uses different attribution logic; apples-to-apples is structurally impossible
  • Walled-garden conflict of interest — Amazon measuring Amazon spend is not an independent incrementality test
  • No integration with brand or performance media — cannot show how paid social drives retail shelf velocity

One System. Every Endpoint.

LiftLab integrates DTC, retail velocity, and retail media incrementality into a unified model that updates weekly, providing consistent metrics for both your CMO and CFO. Instead of separate reports for each channel, you receive a single, comprehensive system.

Layer 01 — Unified ModelAuction Dynamics

All key metrics, including DTC revenue, retail velocity, retail media, and trade promotions, are consolidated into one model.

LiftLab simultaneously processes your DTC transaction data, retailer POS data, retail media spend, and promotional calendar. This enables visibility into a Meta campaign’s impact on Walmart shelf velocity and DTC conversion within the same model. Promotional lift is separated, allowing your CFO to assess true media ROI rather than promotional effects that are misattributed. Weekly updates ensure the model aligns with your decision cycle.

Explore Agile MMM
Layer 02 — Retail Media Closed LoopConsumer Response

Amazon holdout results are used to permanently calibrate the model rather than leaving it static in a presentation.

The Trust Engine™ incorporates geo holdout results from retail media experiments directly into the Agile MMM as calibration inputs, continuously refining channel response curves. For challenger CPG brands, this provides independent, causal evidence of Amazon DSP performance for joint business plan negotiations, rather than relying solely on Amazon’s dashboard metrics.

See Incrementality
Layer 03 — Weekly Signal, Daily IntelligenceExperimental Calibration

When a retail promotional window opens on a Monday, you have a reallocation signal by Tuesday.

PlatformSense processes data from over 70 ad platforms daily, including Amazon Ads, Walmart Connect, and major paid social and search channels, and identifies efficiency changes within 24 hours. For CPG brands with weekly promotional calendars, this enables timely decisions based on current data, helping you capitalize on promotional opportunities rather than reacting after the fact.

Explore PlatformSense
Layer 04 — PE-Board Defensible OutputsScenario & Validation

Conserve. Maintain. Accelerate. In contribution margin language your board already speaks.

The Scenario Planner generates budget scenarios that account for constraints, including CAC payback, changes in contribution margin, and revenue outcome ranges. This aligns with the financial criteria used by PE-backed CFOs for capital allocation decisions. Marketing budget discussions shift from relying on ROAS to evaluating model-based scenarios with clear trade-offs.

Explore Scenario Planner

The New-Age CPG Brands Before and After LiftLab

BEFORE LIFTLAB

  • DTC attribution appears strong because it only measures 32% of your business that is tracked digitally. The remaining 68% in retail is not captured.
  • Amazon DSP, Walmart Connect, and Instacart all report similar shelf conversion rates. Your media team averages these figures, but none are fully accurate.
  • Q4 media ROI appears inflated due to the impact of Black Friday promotions. The finance team has raised concerns about this for two years.
  • Brand budgets are often the first to be reduced during a weak quarter, as no model has demonstrated their impact on future household penetration or customer acquisition cost.
  • Quarterly MMM results are delivered in November for campaigns that ran in August. By then, four additional budget decisions have already been made using platform dashboards.
  • During the PE board review, they request blended CAC across DTC and retail. When you present platform ROAS instead, the discussion cannot progress.

AFTER LIFTLAB

  • At a minimum, a unified model integrates DTC, Walmart, Target, Amazon, and all retail media networks, providing a comprehensive view of total business revenue rather than only the DTC segment.
  • Additionally, Trust Engine™ geo holdouts identify which retail media networks drive incremental growth before you commit to the next joint business plan.
  • This approach accelerates calibration by clearly decomposing promotional lift, enabling Finance to assess true media ROI rather than relying on inflated holiday figures that do not recur in Q1.
  • No data science team is required. Evidence-based long-term multipliers demonstrate the compounding impact of brand advertising on future CAC, helping protect the brand budget. Reducing this investment results in higher costs 18 months later.
  • No data science team is required. The model provides weekly updates and daily signals, delivering current channel coefficients every Monday. PlatformSense alerts you when a promotional window or platform shift affects optimal allocation.
  • No data science team is required. For PE board reviews, the model presents three scenarios—Conserve, Maintain, and Accelerate—along with blended CAC, contribution margin delta, and revenue outcome ranges, enabling more productive discussions.

Everything You Need.
Nothing You Don’t.

Six integrated capabilities address the measurement challenges that challenger CPG brands face during the DTC-to-retail transition. These are delivered through a unified system, eliminating the need for multiple vendors.

Full-Funnel Budget Planning

Align DTC, retail marketing, trade promotion, and retail media within a single, constraint-aware budget plan. Enter your real-world guardrails, such as RMN commitments, trade obligations, and channel caps, to generate a defensible allocation your CFO can approve without further revisions.

Explore Full-Funnel Budget Planning →

Retail Media Incrementality

Geo holdout tests, designed specifically for retail media, distinguish incremental shelf lift from sales that would have occurred organically. Each result permanently calibrates the model through the Trust Engine™. Enter your next RMN joint business plan with causal proof rather than self-reported attribution.

Explore Incrementality Testing →

Long-Term Brand Value Measurement

Quantify brand advertising's compounding impact on new household penetration and future CAC reduction, calibrated to your category and brand lifecycle. These metrics are incorporated into scenario planning using the P&L terms your PE board applies to capital decisions. This measurement helps prevent brand budgets from being cut when quarterly results fall short of expectations.

Explore Long-Term Brand Value Measurement →

Marginal ROI & Saturation Curves

"See exactly where each channel’s incremental returns flatten at your current spend level, updated weekly. For CPG brands scaling across four or more RMNs, understanding the saturation point for Amazon DSP, Walmart Connect, and paid social determines whether you achieve growth or face an expensive plateau."

Explore Diminishing Returns →

Scenario Planning & Forecasting

“What happens to contribution margin if we shift $500K from paid social to Amazon DSP?” Model Conserve, Maintain, and Accelerate scenarios with constraint-aware revenue outcome ranges, presented in financial terms. This approach is designed for PE-backed growth-stage brands that must justify every capital allocation to a rigorous Finance team.

Explore Scenario Planning →

Real-Time Budget Optimization

24 hours from a platform shift to an actionable reallocation signal. PlatformSense covers 70+ platforms including Amazon Ads, Walmart Connect, and all major paid channels. When a retail promotional window opens or a competitor makes a move, the signal reaches you before the weekly revenue data confirms the missed opportunity.

Explore Real-Time Budget Optimization→

Frequently Asked Questions

LiftLab integrates retailer POS data, syndicated scanner data (NielsenIQ, Circana), DTC transaction data, and media spend as model inputs. The Agile MMM quantifies each channel's contribution to total cross-distribution revenue, including in-store conversions, by isolating consumer response from marketplace dynamics. No in-store pixel is needed. The model determines the link between digital media spend and retail velocity outcomes through statistical analysis, calibrated with geo-experiments when available.

Your Retail Revenue Deserves A Model That Can See It.

Book a 30-minute session with a LiftLab marketing scientist. We’ll model your DTC+retail+retail media revenue decomposition with your real data and show you exactly what each distribution endpoint contributes — and where the next dollar compounds fastest.

DTC + retail unified
Retail media independently verified
First scenario in weeks
SOC 2 & ISO 27001 certified
Your Retail Revenue Deserves A Model That Can See It.