How to evaluate an MMM platform architecture comes down to one distinction: does measurement change decisions or just report them? The marketing mix modeling platform that satisfies all seven questions simultaneously operates a closed-loop system where experiments update models and models drive budgets in real-time.
“An MMM platform tells you what worked, what’s true, and what’s causal. The one that matters tells you what to do next and gives Finance a reason to say yes.”
Monday Morning Takeaway
“Most platforms close the measurement gap. Very few close the decision gap.”
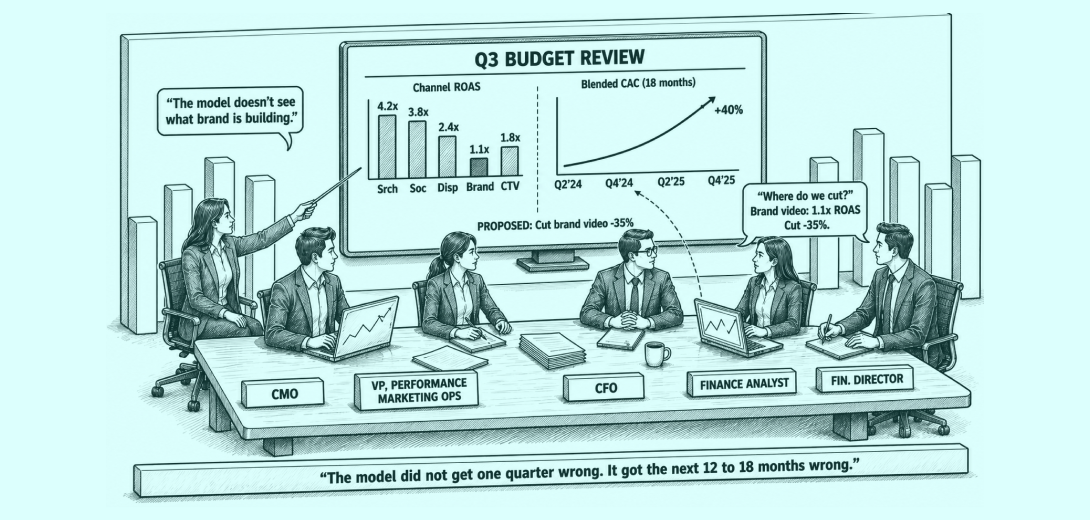
Q3 planning review. The CMO walks in with a quarterly model readout. Finance has one question: where do we cut? The model is unambiguous. Performance channels are earning their keep. Brand video is not. The CFO moves to pull 35% of brand investment. The CMO has no counter argument the room will accept. The model says cut.
Eighteen months later, CAC is up 40%.
The performance channels still show the same ROAS, but against an audience that keeps shrinking.
The model did not get one quarter wrong. It got the next 12 to 18 months wrong.
Marketing budgets have flatlined at 7.7% of company revenue. When the model cannot defend brand investment in finance language, every budget cycle starts from a weaker position than the last. Most brands arrive at the wrong platform not because they skipped due diligence, but because the criteria they used cannot reveal whether the architecture will produce correct budget decisions. The evaluation was thorough. It was evaluating the wrong things.
Measurement tells you what worked. It does not tell you what to do next.
“The category thinks the problem is knowing what’s true. The real problem is knowing what to do.”
How do you evaluate an MMM platform
To evaluate an MMM platform, assess whether it changes budget decisions, not just reports performance. It should separate cost from demand, measure total revenue, update weekly, integrate experiments, and quantify long-term impact. This ensures the platform reflects true marketing effectiveness, not just channel efficiency. If it cannot influence next week’s decisions, it is reporting, not decision-making.
Why Standard Evaluations Fail
A clean interface tells you the vendor invested in UX. A strong reference call tells you a similar company was satisfied. A competitive price tells you the cost of entry. None of those reveal whether the platform separates auction dynamics from consumer response. None reveal whether offline revenue is visible to the model. None reveal whether outputs arrive in time to change Monday’s decision.
“You are not buying an MMM platform. You are buying a system your CFO can defend”
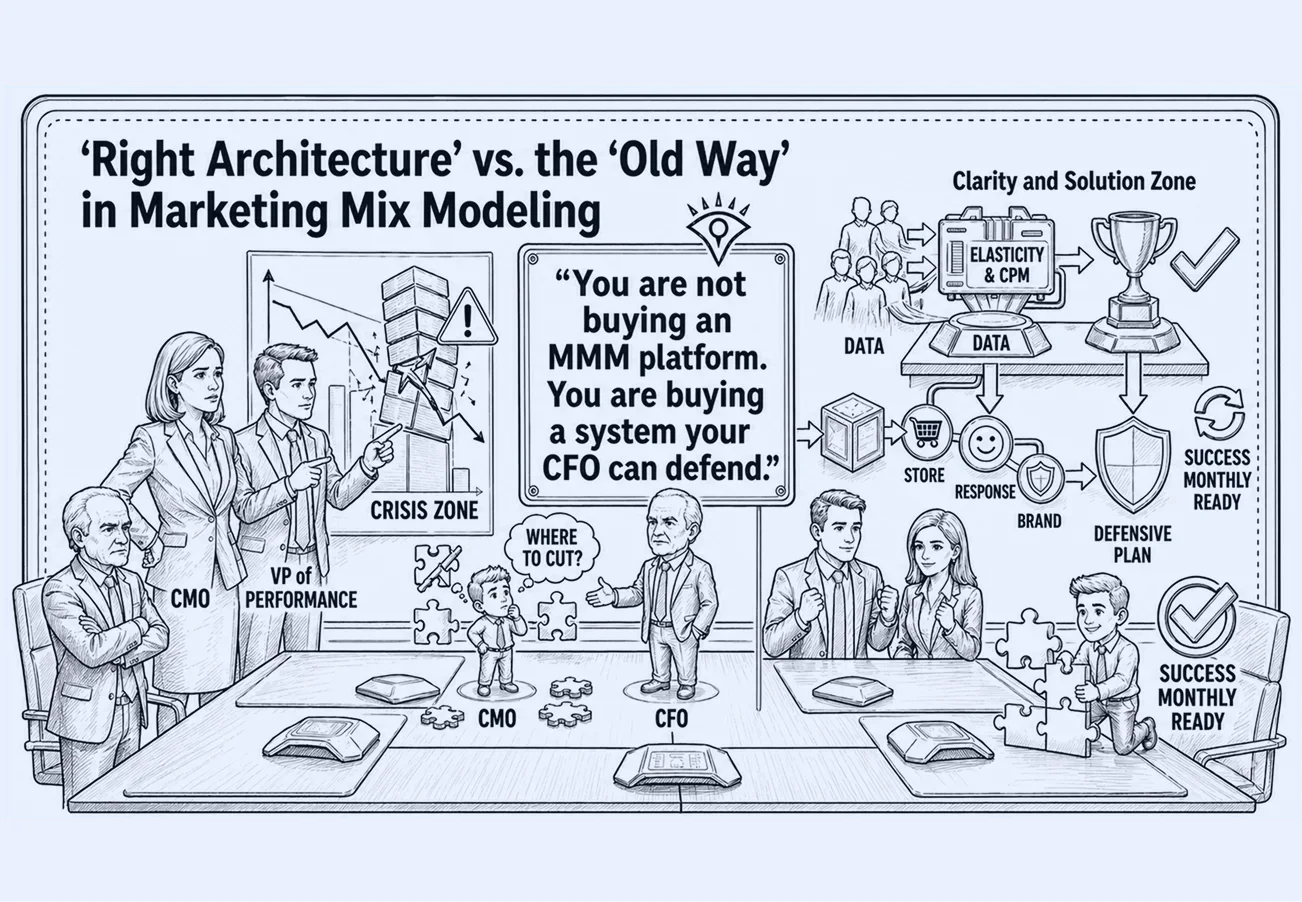
That is not a capability gap. It is an architecture problem.
MMM platform selection is where the marketing measurement architecture gets set.
The category optimized for analytics, not for decision-making. The 7 questions below are organized around the budget decisions they govern. Most platform failures follow three architectural patterns: single-stage models, online-only models, and uncalibrated systems. Each one names the direction in which allocation breaks when the question is answered wrong. Bring them into the vendor demo. The answers will tell you more in 20 minutes than three reference calls.
Most platforms in this category fail multiple of these questions simultaneously, not because they lack features, but because they were never designed as decision systems.
Most platform failures follow three architectural patterns: single-stage models that collapse cost and demand into a single signal, online-only models that optimize against a partial view of revenue, and uncalibrated systems where models and experiments never connect. The seven questions below surface which of these patterns a platform falls into and how that failure shows up in budget decisions.
Q1: Does the model separate auction dynamics from consumer demand?
Q4 arrives. CPMs compress. Meta shows 3.8x ROAS. The brand scales 30%. Q1 demand normalizes; ROAS falls to 1.2x. The model never separated cheap inventory from true response. Both moved together and were treated as one.
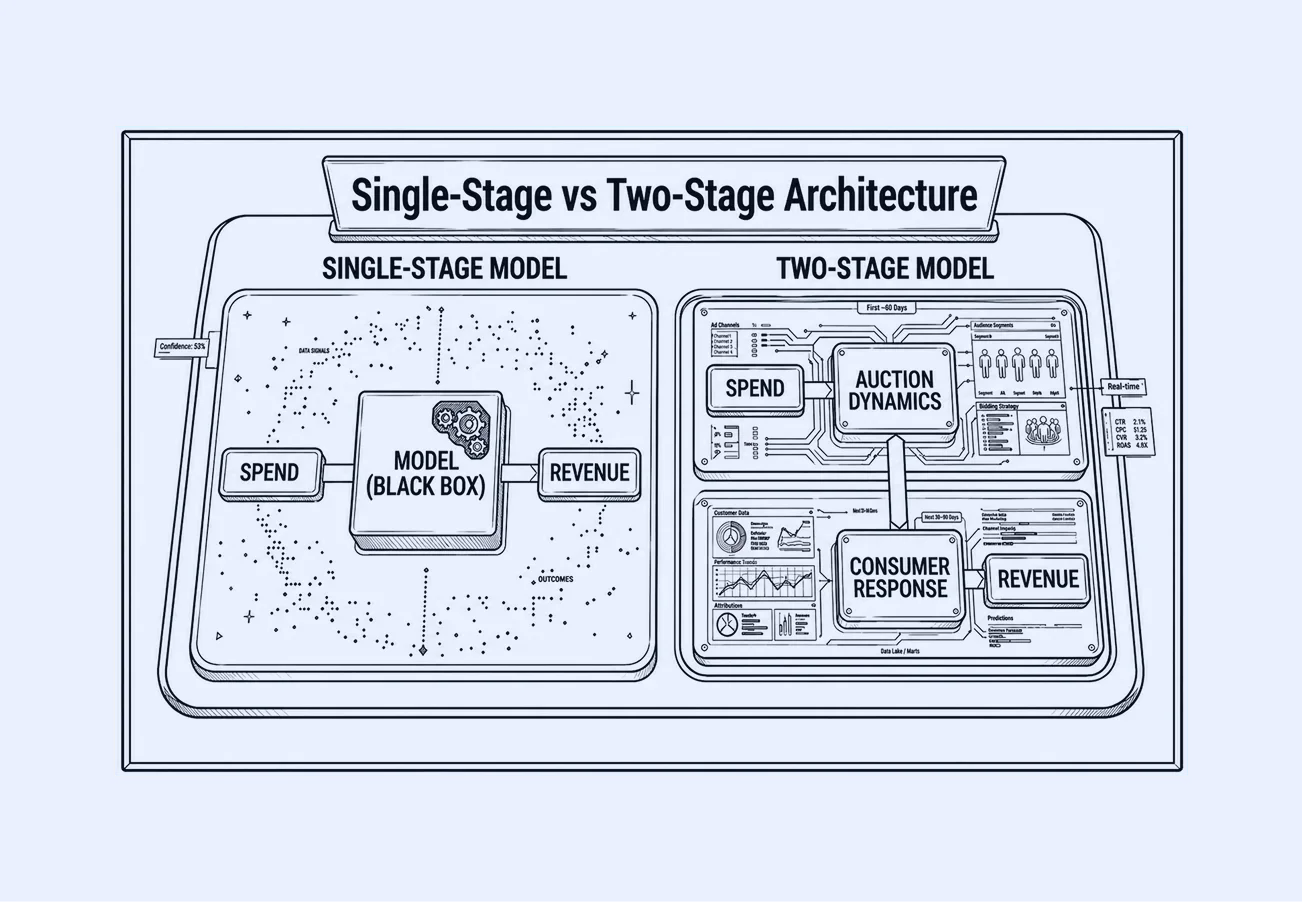
Allocation depends on effectiveness. If cost efficiency and consumer response are not modeled independently, channels are over-credited when auctions are cheap and under-credited when they tighten. This difference is not theoretical, it’s architectural, and it becomes obvious when you see how the two models are actually constructed. Single-stage models compress delivery and impact into one signal; two-stage architectures separate auction dynamics and consumer response so you can optimize true consumer impact, not auction efficiency.
In a survey of US marketers spending over $500K on digital advertising, 61.4% say they are augmenting measurement with better and faster MMM. SKIMS worked with LiftLab to separate Meta auction dynamics from true consumer response, enabling budget decisions based on effectiveness signals, not platform-reported ROAS that fluctuated with inventory pricing.
Verifiable test: Name a channel, a month, and the coefficient shift when CPMs rose without a spend change.
Red flag: Spend as the primary input.
Green flag: LiftLab’s AMM uses a two-stage architecture: Stage 1 captures auction dynamics (CPM elasticity, competitive pressure), and Stage 2 captures consumer response with named inputs. This separation allows budget decisions to be based on effectiveness signals, not cost fluctuations.
⛔️ Disqualifier: No separation means cost and response move as one signal. Performance channels are over-credited when auctions are cheap and under-credited when they tighten. Same direction, every quarter.
Q2: How does the platform handle offline and third-party retail channel data?
The model evaluates TV against online conversions. TV shows 0.9x ROAS. The brand cuts 40% over two cycles. In-store sales decline without explanation. TV’s impact on foot traffic sits outside the model. The brand defunds a primary offline driver. The model calls it optimization.
E-commerce is 16.1% of US retail. Optimizing that slice is not what omnichannel marketing measurement tools are designed for. In one documented NIQ client case, retail media showed 14:1 ROAS; MMM put it at 0.4:1. A different decision, repeated across cycles.
For any omnichannel MMM implementation where the majority of revenue runs through physical retail, optimizing against online conversions alone means the model is right about the wrong outcome.
Verifiable test: Name the dependent variable. Show TV’s effect on in-store sales as a separate term. Name the POS source and last update.
Red flag: “Omnichannel” with e-commerce as the dependent variable.
Green flag: LiftLab ingests POS data as a named data source and models total sales as DTC + third-party + brick-and-mortar components; TV coefficient estimated on total sales, with store term updated as POS data refreshes.
⛔️ Disqualifier: No offline variable; cuts look right and are wrong.
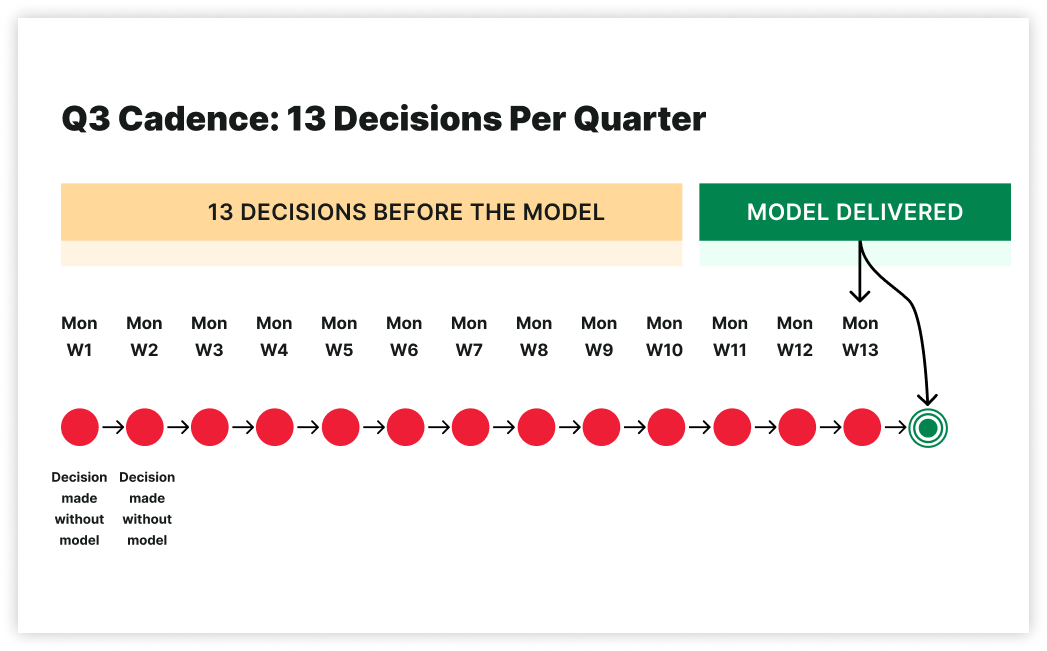
Q3: What is the refresh cadence, and can the model inform this Monday’s decision?
A new Meta creative launches Tuesday. CTR up 18%. CPC down 12%. Three weeks later, the model refresh shows the lift came from a temporary auction gap that closed in week two. The budget that scaled has no incremental lift left.
13 decisions per quarter occur without the model while it is being prepared.
That is archaeology.
IAB’s December 2025 guidance sets weekly refreshes as the minimum. Pandora, after implementing LiftLab, describes bridging long-term goals with short-term optimization.
Verifiable test: Name a channel where this week differs from last month due to CTR or CPC. Give channel, signal, date.
Red flag: Quarterly reports.
Green flag: CTR and CPC feed a daily modifier layer that adjusts channel effectiveness within 24 hours, leaving long-term response curves unchanged. LiftLab’s PlatformSense applies these daily signals as indexed effectiveness modifiers within stable long-term response curves, delivering 24-hour responsiveness without re-estimating the full model.
⛔️ Disqualifier: No signal-driven change. Decisions run on averages; latency is unrecoverable.
Q4: How are MMM outputs connected to incrementality experiments, or are they siloed?
The model shows Paid Social at strong ROI. A 30% increase is considered, backed by two years of MMM data. Whether that ROI was ever tested is unknown. It has not. The model was trusted because it was never challenged.
Without experimental calibration, a high Paid Social coefficient is indistinguishable from coincident demand, direction presented as certainty. In a BCG case example, through frequent updates and calibration, the platform improved marketing spend efficiency by 20%. IAB’s November 2025 guidelines sets credible counterfactuals as the minimum. When the experiment lives in a separate platform from the model, results require manual interpretation and manual re-entry, creating a gap where human judgment replaces systematic calibration, and where the model’s priors never actually update. A siloed incrementality module cannot recalibrate the model.
Verifiable test: Name the last coefficient changed by an experiment. Include channel, parameter type (saturation, response curve, or priors), experiment, and date. If the vendor names a channel and date but cannot show which model parameter changed and by how much, the loop is not closed
Red flag: Incrementality as a separate module.
Green flag: LiftLab’s Trust Engine closes this loop. Experiments are designed based on where the AMM shows the highest coefficient uncertainty, and results feedback directly to recalibrate saturation parameters and response curves, with at least one named instance where a channel’s ROI or saturation curve changed as a result, including date.
⛔️ Disqualifier: Separate systems create separate truths. Drift follows. Trust breaks when the model contradicts reality.
When brands address these structural gaps, misallocation becomes visible because the measurement finally could see it.
“An MMM model explains performance.
An MMM system drives decisions.”
The first four questions test whether the platform can see the full picture. The next three test whether it can act on it.
Q5: Does the optimizer produce a plan Finance can actually approve?
The model recommends shifting $4M from TV, but $2.8M is locked in upfront commitments. The plan is rebuilt manually; the model is ignored. It solved the wrong problem.
“We needed a single view of performance and a means to estimate the marginal profitability of our last dollar spent. LiftLab was the only vendor that offered this.” Jeff Rosenfeld, SVP Digital & CX, Cinemark ”
An optimizer without constraints is a simulation.
Verifiable test: Lock pre-committed TV spend and rerun.
Red flag: Optimizer runs before constraints.
Green flag: LiftLab’s Scenario Planner takes committed spend floors, platform minimums, and channel caps as required inputs before generating outputs, ensuring every recommendation reflects the budget the team can actually execute, not the theoretical optimum.
⛔️ Disqualifier: cannot accept guardrails.
Result: Budget defaults to last year, and the platform becomes post-hoc justification instead of forward allocation.
“Accuracy doesn’t make decisions.
Trade-offs do.”
See how LiftLab closes the gap between measurement and decision.
Q6: How is long-term brand equity quantified on the P&L?
Most models judge brand investment on the wrong time window. Without a 52-week multiplier connecting Q1 brand spend to Q3 baseline demand, the brand is always going to look inefficient against a performance channel evaluated on the same ROAS window.
The 1.1x is wrong because the horizon is wrong. Without a 52-week multiplier translating Q1 brand into Q3 baseline demand, brand is judged on the wrong window. Most marketers cannot confidently translate brand investment into a dollar impact on the P&L, which is why brand is consistently undervalued in budget decisions.
Verifiable test: Name a client where Q1 brand changed Q3 baseline demand; give the dollar delta. If the answer cites adstock, ask for the multiplier window. Adstock captures weeks; brand compounds over quarters.
Red flag: Long-term effects via adstock.
Green flag: LiftLab’s long-term multiplier converts brand spend into a compounding economic value figure on the P&L, giving Finance a dollar number next to brand investment, not a brand lift percentage that requires a separate translation.
⛔️ Disqualifier: No dollar figure. CAC rises; the model records it as market conditions.
Q7: Will the model’s outputs inform next Monday’s decision, or last quarters?
A model that is technically correct but operationally inaccessible produces the same outcome as a model that is wrong. The question is whether outputs arrive in the hands of the person making Monday’s budget call, in a format they can act on, without requiring a data scientist to interpret them first.
If outputs don’t map to a person, format, and decision, it’s reporting.
Verifiability Test: Who gets outputs Monday, in what format, and which decision changes?
Red flag: Vendor-led walkthroughs.
Green flag: Named owner, cadence, decision linkage.
⛔️ Disqualifier: Vendor interpretation required; outputs explain, not change.
The Verdict
In practice, these questions collapse the shortlist quickly. Most platforms satisfy some. Architectures that satisfy all seven share one trait: they were built as decision systems from the start, not assembled into decision systems after the fact. That is the distinction the demo will not show you. The answers to these seven questions will.
Q1 wrong drives repeated performance over-investment. Q2 wrong defunds offline channels because their revenue is unseen. Q3 wrong leaves 13 quarterly decisions made on dashboards while the model is prepared. Q4 wrong scales channels without proven ROI. Q5 wrong files recommendations while budgets follow last year. Q6 wrong cuts brand, with CAC compounding for 18 months. Q7 wrong delivers correct measurement after decisions are made. These are predictable outcomes of architectures not built for omnichannel retail. The direction of failure is nameable. That is what makes it preventable.
When applied to a vendor’s actual architecture, not their methodology deck, most platforms satisfy some. Very few satisfy all seven simultaneously, because doing so requires a single integrated system, not a combination of modules. Weak answers cluster architecturally, not randomly.
“The clustering is not abstract. It follows repeatable failure patterns.”
The 7-Question Scorecard
| Questions | Budget Decision Governed | Red Flag | Green Flag | Disqualifier |
|---|---|---|---|---|
| Q1 | Performance channel allocation | “We use spend as the primary input variable” | Two-stage model named mechanically: Stage 1 captures auction dynamics; Stage 2 captures consumer response with named inputs | No separation means cost and response move as one signal. Performance channels are over-credited when auctions are cheap and under-credited when they tighten. Same direction, every quarter. |
| Q2 | Cross-channel allocation when majority of revenue is offline | Dependent variable is online conversions or e-commerce revenue only | Named POS data integration; separate model terms for DTC, 3P e-commerce, and brick-and-mortar | No offline variable means every cut recommendation is technically correct per the model and systematically wrong for the business. |
| Q3 | In-week and in-month budget reallocation | “We deliver quarterly reports with updated recommendations” | Daily effectiveness modifiers on stable long-term response curves; alert system within 24 hours of deviation | No signal-driven updates mean the model runs on historical averages. 13 budget decisions per quarter made on dashboards. Latency is not recoverable. |
| Q4 | Scale, hold, or cut decisions on major channels | “Incrementality testing is available as a separate module” | Named instance where experiment results updated model coefficients (saturation, response curve, priors) with date | Siloed experiments mean the model drifts from ground truth silently. Trust breaks when it recommends something the business already knows is wrong. |
| Q5 | Turning model output into an executable media plan | Optimizer does not require or accept business constraint inputs | Pre-committed spend, minimum floors, maximum ceilings tied to optimization objectives (revenue, profit, CAC) | No constraint inputs mean the output is a theoretical optimum the business cannot execute. Budget defaults to last year. The platform had no role in the decision. |
| Q6 | Brand vs. performance allocation in CFO review | “Long-term effects are captured through adstock” | Named long-term impact mechanism; counterfactual baseline available (e.g., Q1 brand investment visible in Q3 baseline) | No dollar figure for brand’s impact on future baseline demand means the CMO loses the CFO argument every cycle. CAC rises. The model records the damage as market conditions. |
| Q7 | Whether model outputs reach Monday’s decisions or lag | Outputs require vendor data scientist interpretation before client team can act | Outputs require vendor data scientist interpretation before client team can act | Vendor interpretation required means the platform is a reporting service. The model explains what happened. It does not change what happens next. |
Architecture designed around all seven questions: evaluate your current platform against this framework at
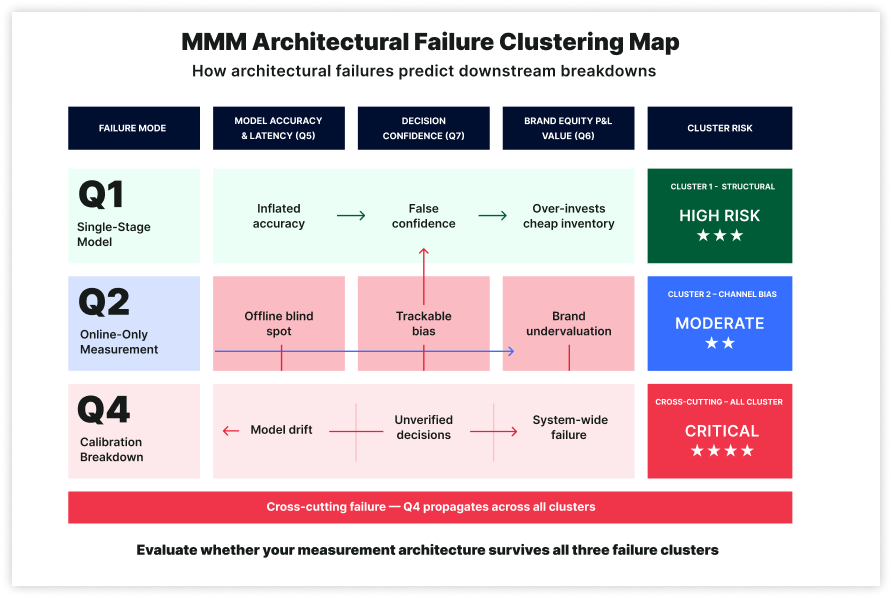
Weak answers cluster architecturally, not randomly. Single-stage models fail Q1, Q3, and Q7 together.
Single-stage models fail Q1, Q3, and Q7 together
If spend is the primary input, the model cannot separate auction dynamics from response, cannot react to signal shifts without full re-estimation, and arrives too late for Monday decisions. A failure on Q1 predicts Q3 and Q7.
Online-only models fail Q2 and Q6 together
If offline revenue is unseen, TV’s store impact is missed, and brand cannot be linked to future baseline demand. Cuts to TV and brand stem from the same structural gap.
Calibration failure spreads across the system
Failure on Q4 spreads. Without calibration, coefficients drift from reality. Errors compound quietly until decisions break.
The architecture that avoids all three failure patterns shares one trait: it was designed as a decision system from the start, not assembled into one.
FAQ: Evaluating an MMM Platform
Is MMM worth the investment for an omnichannel retail brand?
The question assumes MMM is an expense line. The more precise question is what the current architecture is costing per year. A campaign reporting 14:1 ROAS and delivering 0.4:1 actual return is not a measurement imprecision. It is a budget decision made wrong for however many cycles the organization ran it. For an omnichannel brand, the visibility a correct MMM provides is not optional. The right architecture does not add to the cost of marketing. It reduces the cost of being wrong.
How long does it take to see results?
Two answers: the second is the one that matters. Initial directional outputs arrive in weeks. The model becomes defensible for CFO-level allocation decisions after one quarter of calibration, once incrementality experiments have anchored the highest-uncertainty channels in causal evidence. Responsiveness begins on day one. Defensibility matures over one quarter.
What makes LiftLab different from running these seven questions against Recast, Measured, or Haus?
Most platforms fail multiple questions simultaneously due to architectural patterns. Single-stage models fail Q1, Q3, and Q7 together. Online-only models fail Q2 and Q6 together. Without calibration (Q4), coefficients drift until decisions break. LiftLab was designed as an integrated decision system, not assembled from separate modules.
How much does implementing a proper MMM platform cost compared to the current approach?
The cost question reverses the actual economics. Most brands waste significant portions of their media budget on measurement tools that optimize the wrong outcomes. A $10M annual media spend supported by attribution-only measurement typically wastes $2-3M per year on misallocated channels. The platform cost becomes irrelevant when the measurement prevents those losses. The ROI isn’t in the measurement. It’s in the decisions the measurement enables. For most omnichannel brands, proper MMM pays for itself within the first reallocation cycle.
What happens if we implement MMM, but our organization isn’t ready to act on the insights?
This is the most expensive failure mode. Paying for correct measurement while continuing wrong decisions. Organizational readiness matters more than technical sophistication. If budget decisions still default to last year’s allocation, or if Finance cannot interpret MMM outputs, the platform becomes an expensive reporting tool. The solution isn’t more measurement; it’s connecting measurement to decision rights. Most successful implementations start with one decision-maker who can act on weekly MMM outputs, then expand from there.
How do we transition from our current measurement approach without losing historical data?
LiftLab’s implementation preserves your historical investment data while building forward-looking capabilities. Historical attribution data becomes baseline context for the AMM, not discarded information. The Trust Engine validates which past performance metrics were accurate versus inflated, giving you a clearer picture of what actually worked. During the transition, you maintain existing dashboards while LiftLab builds parallel measurement infrastructure. Most clients continue running legacy reports for 2-3 months while the new system proves itself, then sunset the old approach once confidence builds. The goal isn’t to lose institutional knowledge. It’s to separate signal from noise in what you’ve already learned.
For most LiftLab clients, the first planning cycle is where the architecture difference becomes visible.
Ready to Test the Architecture?
Bring these 7 questions into your next vendor conversation and watch how quickly the answers separate viable architectures from the rest or bring them directly to LiftLab. Most vendors will answer some of these questions well. The architecture that answers all seven simultaneously is not a product of better features, it is the result of being designed as a decision system from the first line of code. That is what the demo will show you.
Not ready for a demo?