

Black Friday incrementality is the share of peak-season revenue your marketing caused, as opposed to what the calendar would have delivered anyway. Platform dashboards credit media for baseline demand, existing purchase intent, and discount-driven sales. Geo holdout tests separate those by comparing regions with and without spend. This guide covers when to test, how to design it, and what to do with the result before Cyber Monday.
Executive Summary
Black Friday lifts every channel’s reported return at once, so the dashboard can’t tell you which dollars worked. Test before the peak if you can, lean on your marketing mix model if you can’t, and let marginal return guide your Cyber Monday spend.
What does the Black Friday dashboard actually tell you?
It tells you that nearly every channel won. Paid search conversions are up, retargeting looks almost free, and every campaign beat its target. When everything wins at once, the report can’t say which dollars mattered, and the question Finance will ask in January is how much of this revenue would have shown up if you’d spent less.
Why do Black Friday sales overstate marketing impact?
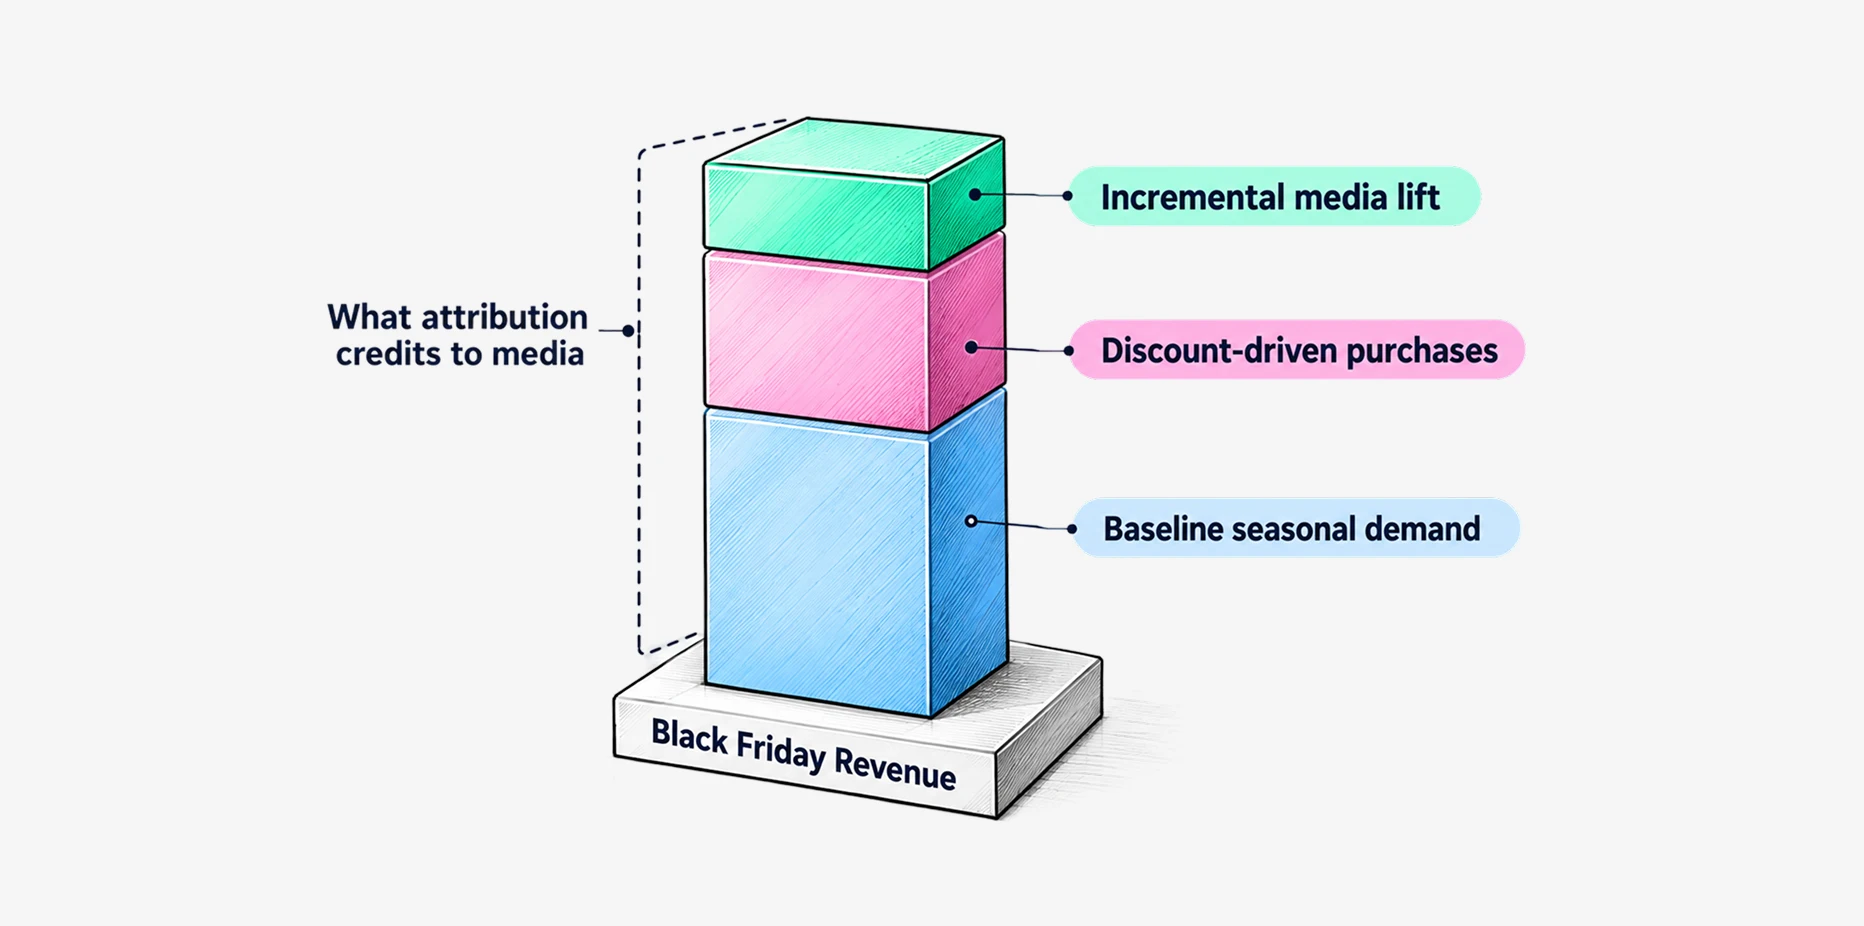
Three forces that work without advertising peak on the same days as advertising: a surge in baseline demand, retargeting pools full of shoppers who already intend to buy, and discounts that move product on their own. Last-touch and platform-reported attribution hand all three to whichever ad appeared last.
The baseline demand surge
Baseline demand is what you’d sell with no paid media, and on Black Friday it jumps. The season as a whole isn’t growing much, though: EMARKETER’s Holiday Shopping 2026 forecast has US retail sales for November and December up 4.1%, the second straight year holiday growth trails the full-year average. Much of the spike is probably demand pulled into a few days, and whatever media ran then collects the credit.
Retargeting that harvests existing intent
Retargeting pools swell in November. A shopper who saved a jacket in October and checks out on Black Friday after a retargeting ad gives that ad full credit for a sale it only witnessed. The warmer a channel’s audience, the wider the gap between its reported and incremental return.
Discount-driven purchasing
A deep discount sells product whether or not an ad announces it. When the promotion and the media flight start the same morning, attribution can’t tell which one moved the shopper, so the media line absorbs the price cut’s effect. Part of what looks like media efficiency is a margin decision. See why promotions inflate media ROAS.
Each signal on the dashboard overstates media impact for a specific reason, and each has a better measure.
| Black Friday signal | What the dashboard reports | Why it overstates impact | What to measure instead |
|---|---|---|---|
| Revenue spike | Record sales during the flight | Seasonal demand rises with or without media | Revenue in exposed versus matched holdout regions |
| Retargeting return | Very high ROAS from warm audiences | Credits ads for shoppers already set to buy | Incremental conversions per dollar from a holdout test |
| Discount conversions | Conversion rate jumps on promoted products | The offer can drive the purchase on its own | Lift with the same offer in test and holdout regions |
| Paid search clicks | Branded conversions surge | Captures intent that other activity created | Incremental return on the next dollar |
When should you test around Black Friday?
Test before the peak when you can, read any peak-period test after demand settles, and test inside the peak only with a revenue-at-risk ceiling agreed with Finance.
| Timing | What it tells you | Main risk | Best use |
|---|---|---|---|
| Pre-peak (late October to mid-November) | Channel returns under lower, steadier demand than the peak | Peak response may differ, and early-season promotions can already lift demand | Reading one channel’s incremental return before Black Friday weekend |
| In-peak (Black Friday week) | Lift under true peak conditions | Volatile demand, uneven auctions, a short test window, and high revenue at risk | Only with a revenue-at-risk ceiling agreed with Finance |
| Post-peak read (December) | How a peak-period test performed once demand settled | Arrives too late for this season’s allocation | Calibrating the model for next season |
A quiet pre-peak result doesn’t mean a quiet peak. Marketing in the weeks before Black Friday can build demand that converts once the sales open, so a modest pre-peak lift may understate what the channel does when shoppers are ready to buy. Treat it as one channel’s result at lower demand, and expect peak response to differ.
How do geo holdout tests measure true Black Friday lift?
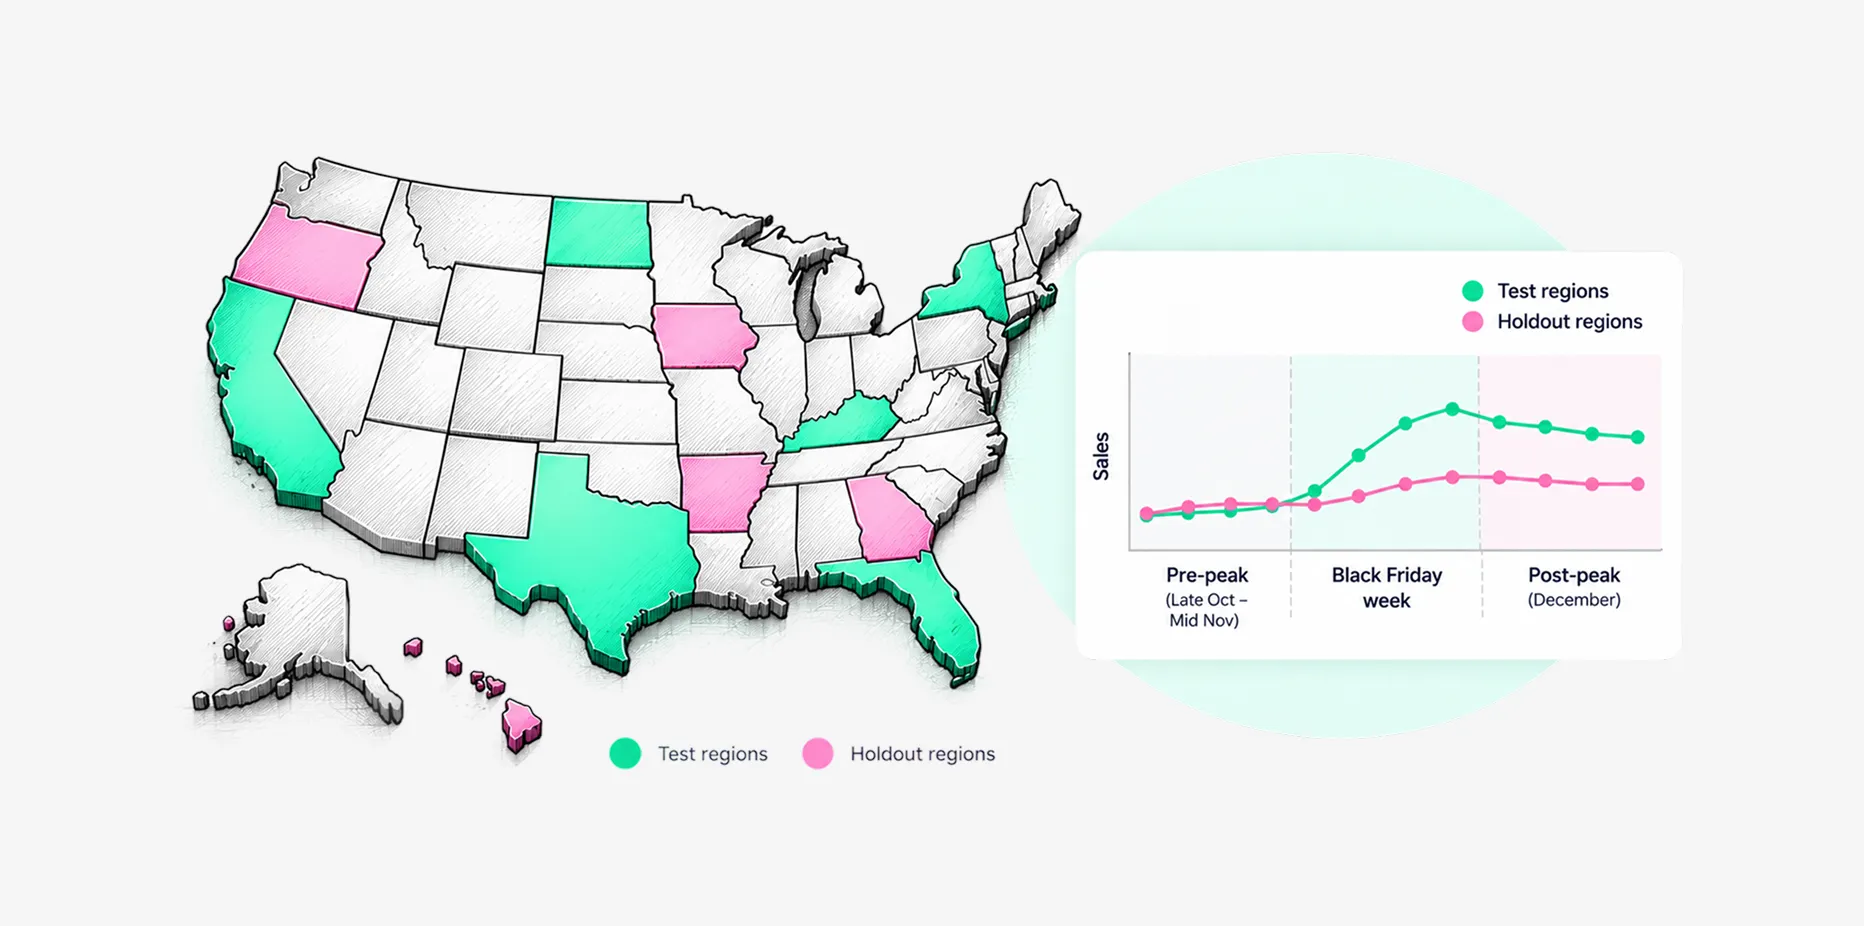
A geo holdout test pauses or reduces spend in selected regions while comparable regions continue as usual, then compares sales between the groups. Seasonal demand, purchase intent, and discounts influence both, so the remaining gap estimates the media’s incremental effect, reported with a confidence range. Four design choices decide whether you can trust that estimate: matched regions, holdout size, test duration, and revenue at risk.
Matched regions
Test and holdout regions should behave alike before the test starts, so group markets by size, structure, and how closely their historical sales moved together, including last year’s holiday period. A poorly balanced holdout reports a gap that existed before any media changed. Also watch for budget leaking back into the holdout: automated campaign types can move spend into suppressed regions through other channels, which compromises any test. LiftLab’s Incrementality Testing Suite monitors for this contamination and corrects for it before results are calculated.
Holdout size
The holdout must be large enough for the expected lift to stand out from ordinary week-to-week noise, so run a power analysis before launch, sized to the smallest effect worth acting on. An underpowered test returns a range too wide to use, which is easy to misread as no effect. A larger holdout sharpens the read and costs more revenue.
Test duration
Cover full weekly purchase cycles plus the delayed response to ads, which for most digital channels plays out over days. Duration depends on sales volume and the effect size you need to detect, and most digital channel tests last several weeks. Stopping early because the result looks good can compromise the findings.
Limit revenue risk
Every holdout gives up some sales, so decide what you can afford before you choose the design. Estimate the revenue at risk as the incremental sales the holdout regions would have produced, agree on a ceiling with Finance, and pick the smallest holdout your power analysis supports. You can also reduce spend instead of pausing it, or leave your highest-revenue markets out of the holdout. Either choice trades some precision for lower risk, so the test may run longer or cover more regions.
What if you do not run an experiment?
You aren’t stuck without one. A well-built marketing mix model can still separate Black Friday incrementality from the demand surge, the discount, and the retargeting pool. Agile MMM estimates each channel’s contribution while accounting for baseline demand, seasonality, and promotions, so the sales spike and the price cut don’t get credited to media, and it reports the result as a range. An experiment tightens that range for one channel.
What should you do with the result before Cyber Monday?
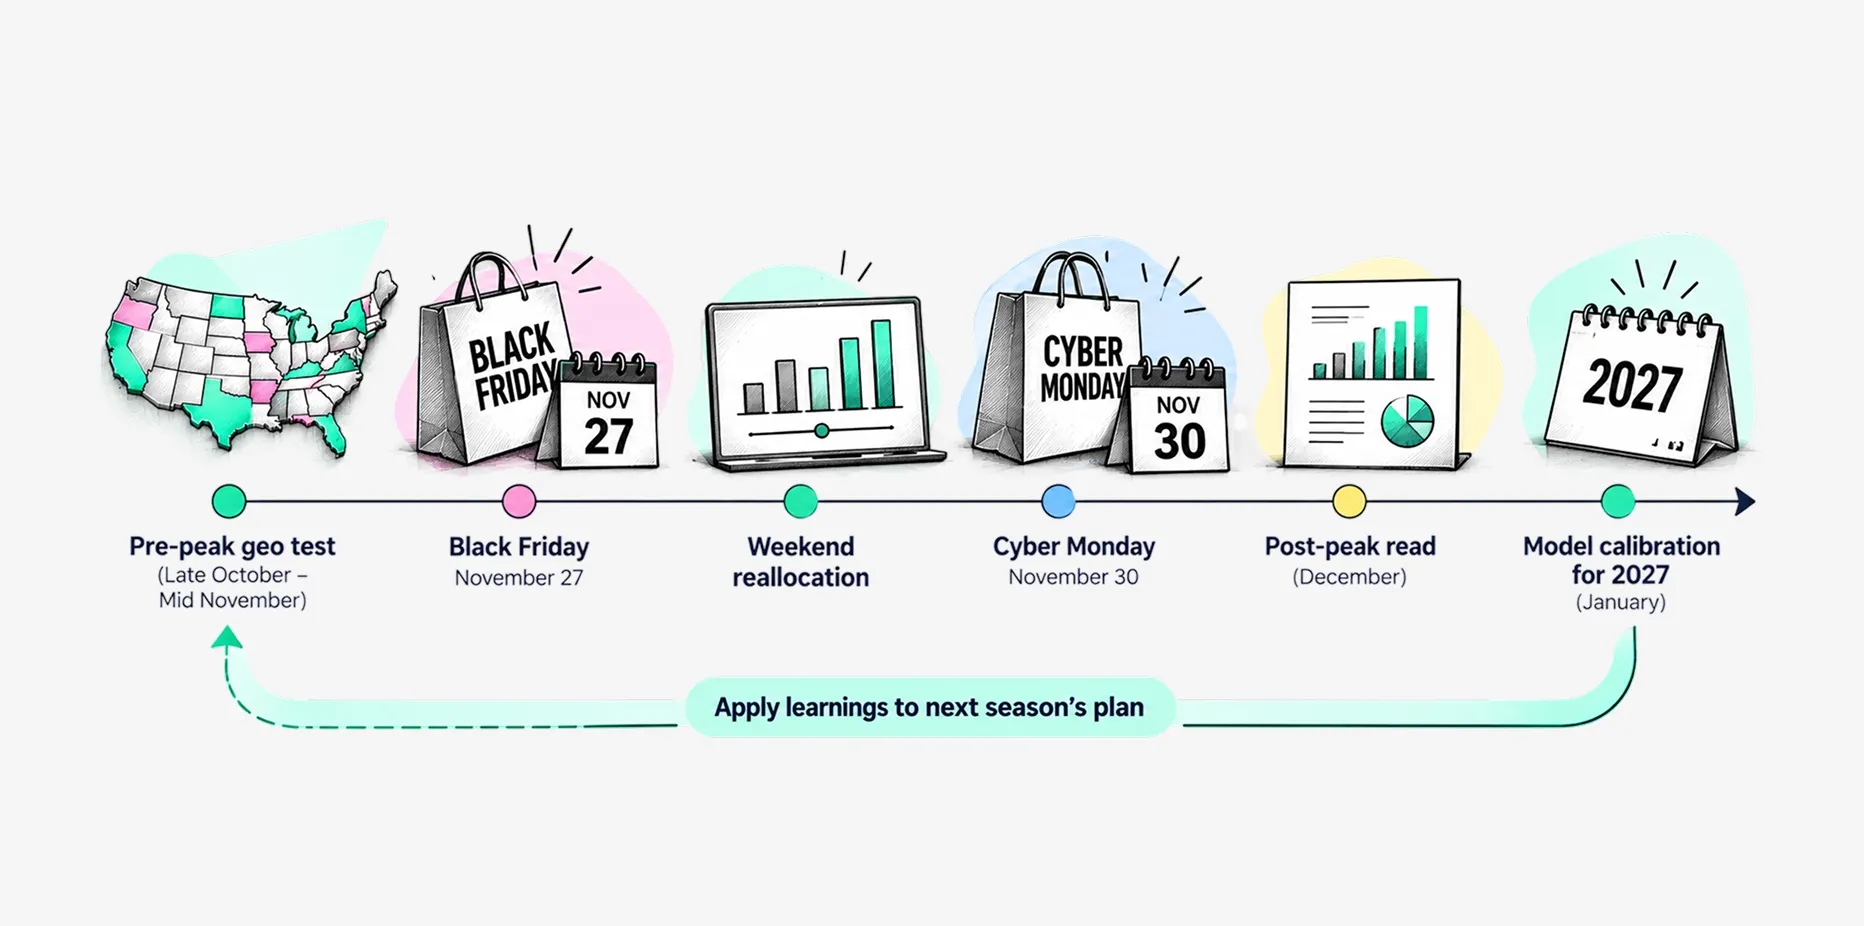
Between Black Friday and Cyber Monday, use your result and your marketing mix model for three moves: shift in-flight spend, rank channels on the return of their next dollar, and feed the result back into the model.
Shift in-flight spend
Black Friday and Cyber Monday sit three days apart (November 27 and 30, 2026), enough time to move money and not enough to debate it. Agree on reallocation rules before the weekend: which channels get more budget if they hold their incremental return, and which get trimmed if warm-audience saturation shows up. Check retargeting caps first, since reported and incremental return often diverge most there.
Rank channels on marginal return
Average return looks backward. Marginal return tells you what the next dollar will do, and a channel with a strong average can be saturated by Saturday. An experiment reads one channel at a time, so use the model to rank them: in LiftLab, marginal ROAS by channel lives in the ROI Dashboard. Fund from the top until each channel’s marginal return flattens, and check the order against daily performance signals as the weekend unfolds.
How fast you can act depends on how fast your data arrives. If sales and media data reach the platform daily, dashboards stay current through the weekend. Uneven lags make a same-week read hard to trust.
Keep the result for model calibration
An experiment that informs one weekend and then sits in a slide deck has done half its job. Feed the result back into your marketing mix model so it recalibrates the response curves and next year’s plan starts from evidence. In LiftLab, the Trust Engine does this for every completed experiment, tightening the curves and flagging the channel with the widest uncertainty as the next one to test.
Turn one season’s test into next season’s plan
Our whitepaper, Measurement to Capital Allocation, shows how marketing mix modeling and incrementality testing work as one closed loop, and how to build spend plans Finance will back. Read it before 2027 planning starts.
If you’d rather talk it through, book a working session with a marketing scientist to read your peak-period results or pick the first channel to test once the season ends.
Key Takeaways
Black Friday lifts every channel’s reported return at once, so the dashboard can’t rank them.
Baseline demand, existing intent, and discounts earn credit that belongs elsewhere.
The cleanest test window is before the peak, and a peak-period test needs a revenue-at-risk ceiling first.
A marketing mix model can separate real lift without an experiment, and a test tightens the range for one channel.
Before Cyber Monday, use the model’s marginal return by channel to guide spend, and feed each experiment’s result back into it.
Frequently Asked Questions about Black Friday Incrementality
How is incrementality different from attribution?
Attribution assigns credit for a sale to the touchpoints a shopper saw before buying. Incrementality estimates whether those touchpoints changed the outcome. Judging whether a purchase would have happened anyway takes a comparison group or a model, and experiments make either more reliable. That gap is why Black Friday ROAS usually overstates media impact. Our guide to <a href=”https://liftlab.com/blog/causal-measurement-in-marketing/”>causal measurement</a> in marketing covers it in depth.
What is a geo holdout test?
A geo holdout test compares sales in regions where spend was paused or reduced with sales in comparable regions where it ran as usual. The gap is the estimated incremental effect of the media. It works on aggregate sales data, so it doesn’t need user-level tracking.
Can I run an incrementality test during Black Friday?
Yes, though the pre-peak window gives a cleaner read. Peak demand moves quickly and holding back spend on the biggest days costs real revenue, so most teams test beforehand and read any peak-period test after demand settles. If you test inside the peak, agree on the revenue at risk with Finance first.
Do I need an experiment to measure Black Friday incrementality?
No. A marketing mix model can separate incremental revenue from baseline demand, discounts, and warm-audience retargeting, and it reports the result as a range. Running an experiment before the peak tightens that range for one channel.
How does LiftLab help with Black Friday measurement?
A marketing scientist works with your team to define the holdout, set the reallocation rules, and interpret the results. The platform runs the test and monitors for spend contamination.