
Each year, marketing teams review what worked and use that to shape next year’s budget. This year, though, mid-2026 looked very different from Q1, and the categories performing best now aren’t the ones most budgets focus on. Those shifts set up the seven patterns below, covering growth, funnel mix, platform efficiency, TV, holiday spend, and AI. The following insights from our recent marketing benchmark report is meant to help senior marketers and CMOs navigate the 2026 holiday season and prepare for the 2027 budget conversations that lie beyond.
show.
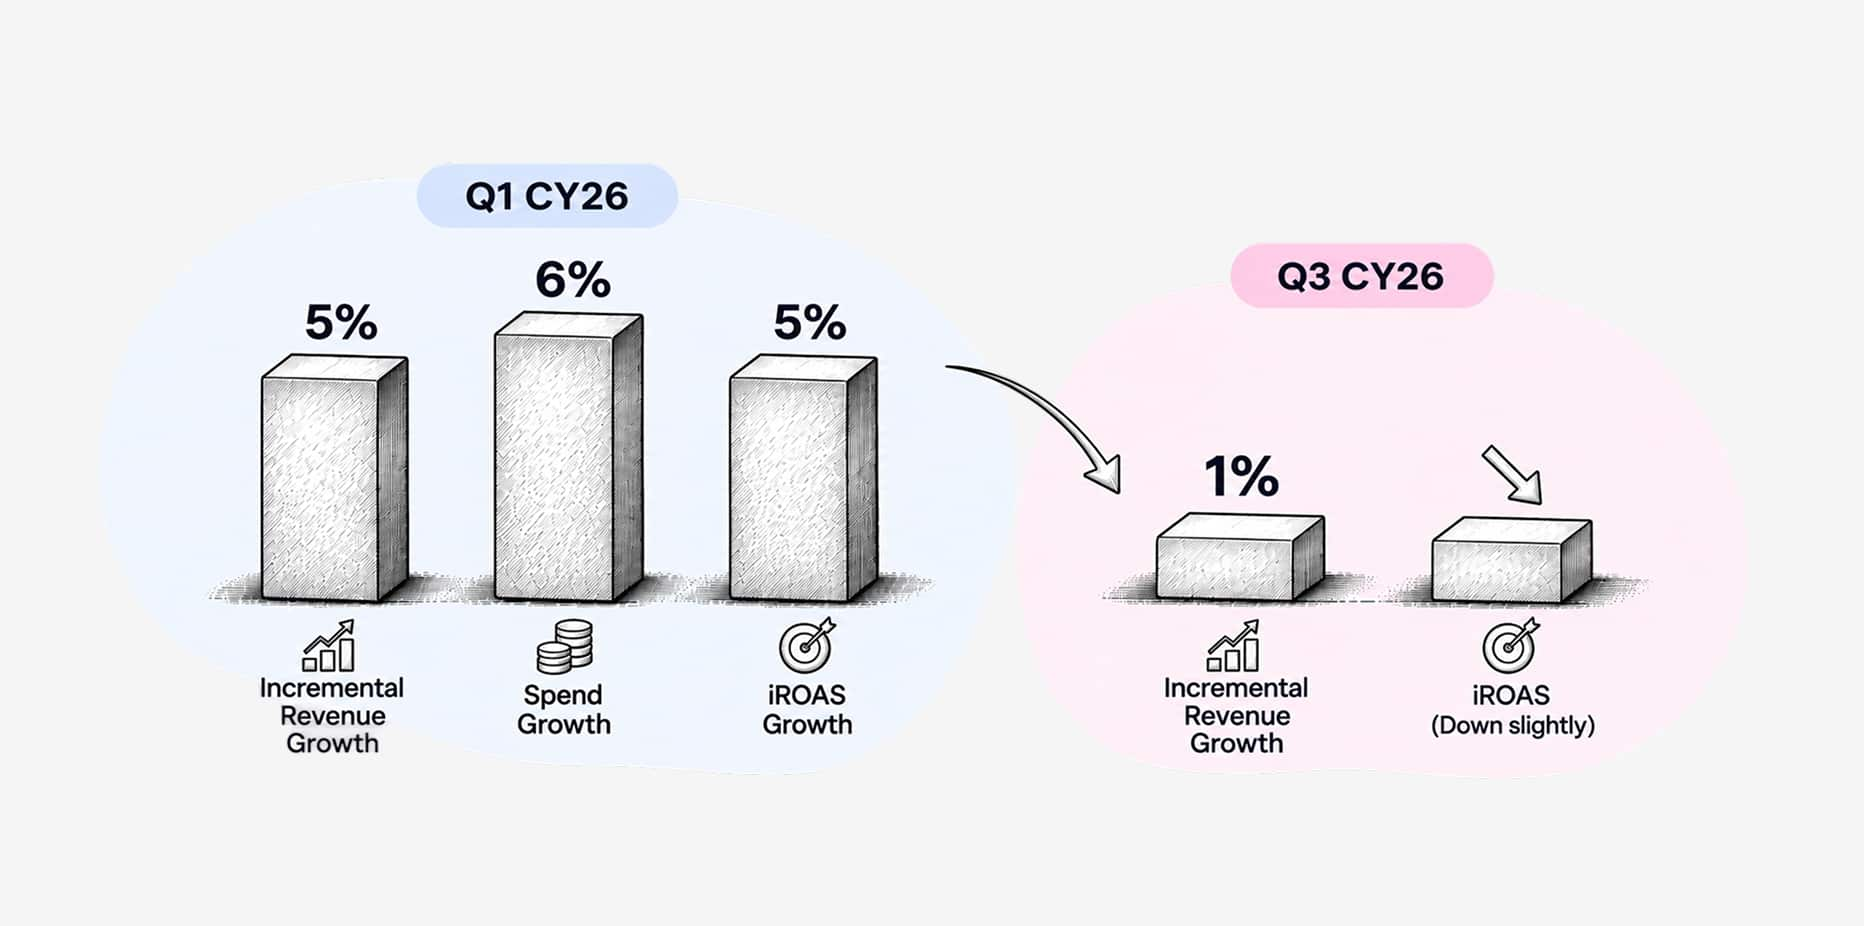
5% YoY incremental revenue growth in Q1 slowed to 1% by Q3
Growth stayed positive all year, but the pace slowed over time. In Q1 CY26, median year-over-year growth was 5% for incremental revenue, 6% for spend, and 5% for total iROAS. This growth came from both greater efficiency and increased spend. By Q3, median revenue growth had dropped to just 1% YoY, with iROAS also down a bit. This pattern matches what we saw in CY25: strong early momentum, a slowdown in the middle, and uncertainty about a late-year rebound. Apparel and Home stood out with the strongest incremental revenue growth, showing that consumers still spend on discretionary items when possible.
Spend is drifting across the funnel, depending on categories
Overall, spend was mostly flat across the funnel, with middle and bottom funnel shares each rising by about one percentage point in Q3 CY26 compared to Q3 CY25. Looking closer, Tech & Services and Durables shifted more toward consideration and conversion, while Apparel, Footwear, and Home focused more on awareness. Two of these up-funnel categories also saw the strongest revenue growth this year, suggesting brands are leaning on product discovery, awareness, and new launches to capture limited discretionary spending.
Google iROAS was higher YoY in every month
Google made up 36% of total media spend, making it the largest single item in the mix and a bit higher than in CY25. It was also the most reliable for efficiency gains. Median client Google iROAS increased year over year in each of the past 12 months, with gains from 1% to 12%. Much of this came from shifting spend among Search, Video, Demand Gen, and PMax, not from spending more overall. In a year when other platforms were inconsistent, Google’s steady performance is a real planning advantage.
Meta and YouTube delivered early, then got more expensive
For most of 2026, Facebook and YouTube had the biggest year-over-year efficiency gains outside of Google. But in Q3, average client iROAS dropped on both platforms. This was mainly due to sharp CPM increases in September, though a slight drop in effectiveness also contributed. It’s too soon to tell whether this is a lasting trend or just a seasonal change, but it’s worth watching for the rest of the year.
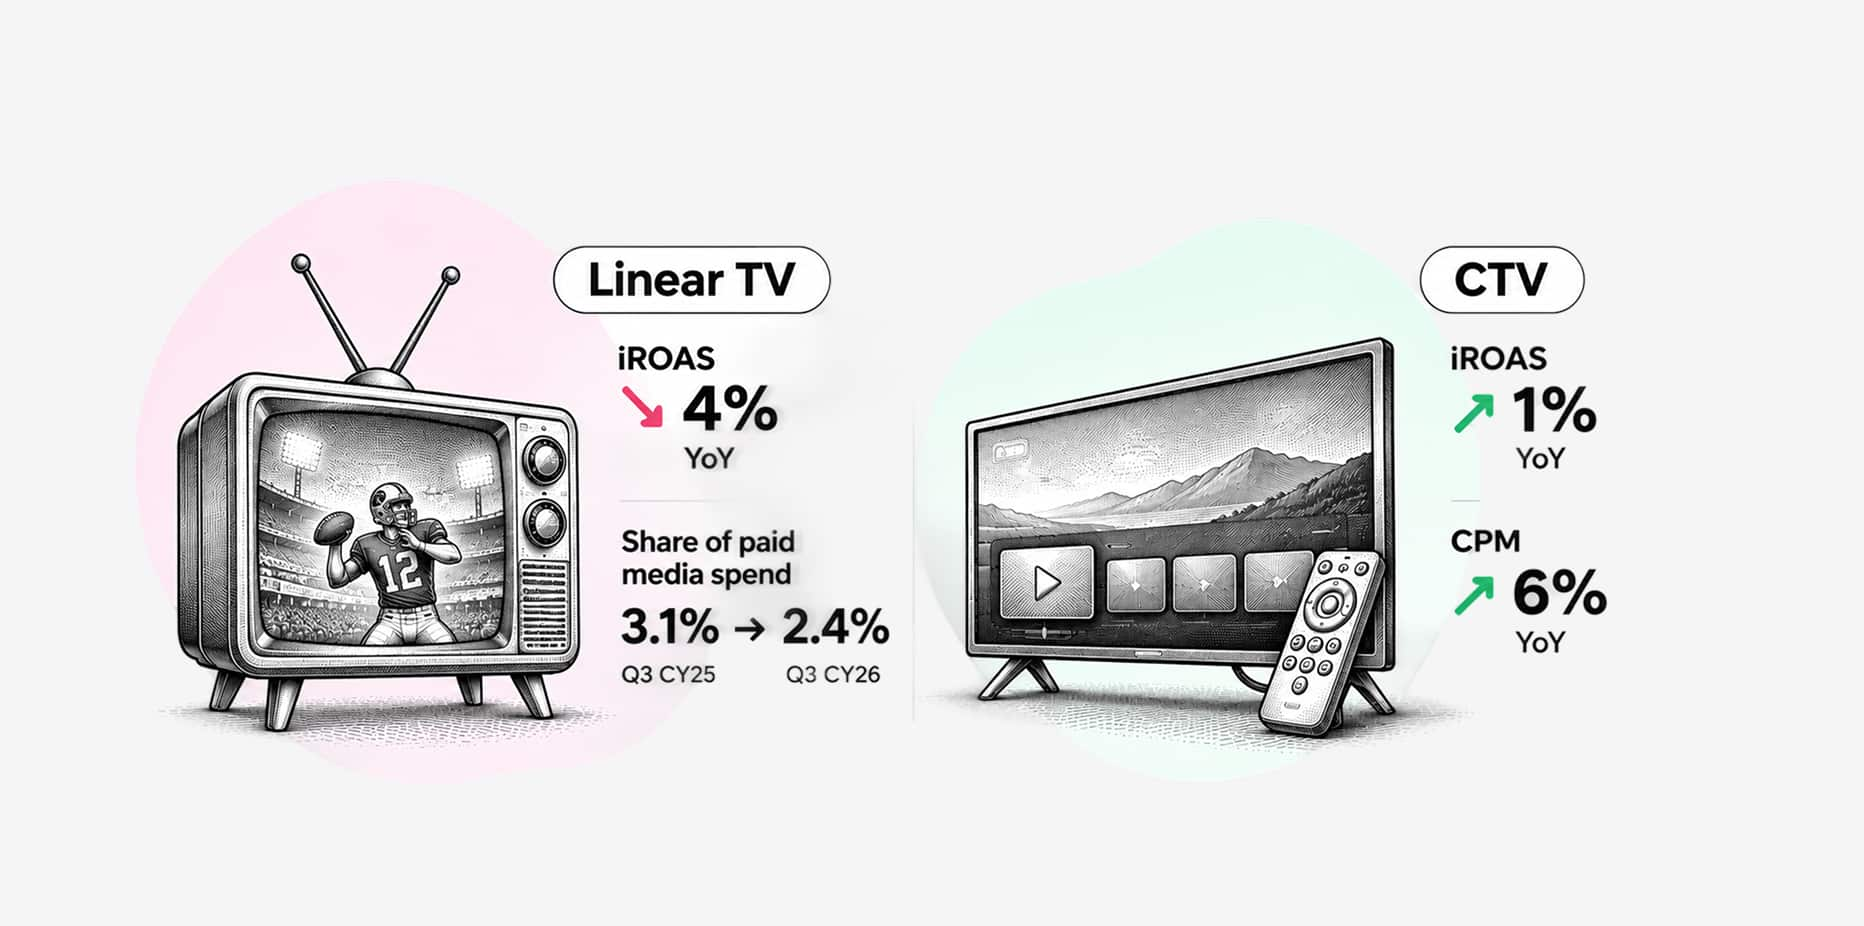
Linear TV iROAS fell 4% YoY, CTV rose 1%
Linear TV’s share of paid media spend kept shrinking, dropping from 3.1% in Q3 CY25 to 2.4% in Q3 CY26. Average iROAS fell 4% year over year, even though live sports stayed strong. CTV is a different case. Many clients started using it in CY25 and kept investing in CY26, though more cautiously. The focus has shifted from whether it works to how to run it well, including partner selection, targeting, and testing. CTV CPMs rose 6% YoY, limiting the median iROAS gain to just 1%. For many, the CY27 goal is to move CTV from discovery to real experimentation and then to optimization.
September priced in the holidays early
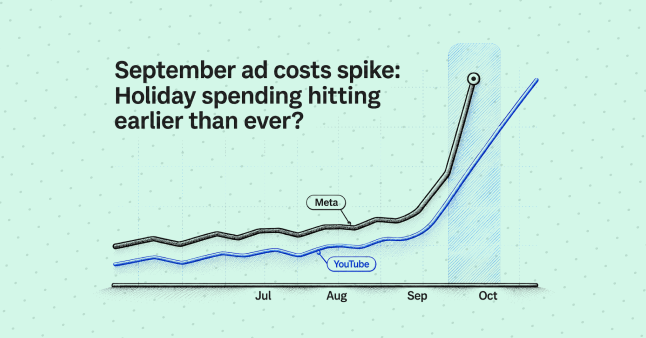
Costs usually rise as Q4 approaches, but the increase in 2026 was much sharper than usual. Year-over-year CPM increases in September were about 5 percentage points higher than the rest of the year. The spike varied by platform: Meta CPMs jumped 21% YoY in September, compared to just 4.5% for the rest of CY26, and YouTube CPMs rose 26% YoY in September after being below CY25 levels for the first seven months. This likely happened because the market started bidding up holiday inventory earlier than usual. Keep this in mind when planning your CY27 holiday spend timing. Then consider where AI fits next.
AI advertising is not ready to be benchmarked yet
Advertising on AI platforms became a real topic in 2026. So far, only a few clients have tried it, and early test data is too limited to conclude how it performs compared with other paid media, so there are no marketing spend benchmarks for this channel yet. This doesn’t mean the channel doesn’t work, though. Just that it’s too early to tell how effective it is. Measurement methods are still being developed as adoption and available data grow. That leaves the planning takeaway for CY2027: treat AI advertising as an area to watch, test carefully, and revisit as more data becomes available and measurement matures. For now, it should remain on the list, but not yet as a benchmarked channel.
What this means for CY2027 planning
As we head into the holidays and into CY2027 planning, focus on protecting what’s working while adjusting as costs and performance evolve. Google remains a solid contributor, with room for further optimization within its own stack. Meta, YouTube, and CTV all merit more attention, with CTV in particular being an area where we can move from experimentation to optimization. The category differences remind us that one allocation strategy will not fit every brand this year.
The key takeaway for CY2027 is to plan the year against two cost scenarios: 2026’s normal rate of CPM increase, and September’s much sharper one. Then agree with your CFO in advance what you’ll move if costs follow the second.
Together, these patterns should guide how you move into CY2027.
Frequently Asked Questions about Marketing Benchmark Report 2026
Did every category experience the same degree of growth slowdown in 2026?
No. The cross-category median clearly showed a slowdown in growth, but Apparel and Home were the exceptions, with the strongest incremental revenue gains in the year.
Why did Meta and YouTube iROAS fall in Q3?
Primarily due to higher costs. Both platforms saw significant CPM increases in September, with some additional layer of effectiveness decline on top. The full trend will be clear in Q4, once election season is over.
Is linear TV dead as a media channel?
Its role is certainly shrinking, and it’s less efficient than it once was. There are still areas of the market where it works well (live sport being the prime example), and campaigns designed to reach a very broad audience will still work on linear.
What should a brand be doing with its CTV spend in CY2027?
Hopefully, you’ve already been experimenting with CTV. If not, think of Q1 as your time for experimentation. Use it to figure out which partners to choose, what targeting works best, and which test designs to use. Then, in CY2027, you can shift your spend to real optimization instead of more discovery.
Is it too early to get into AI advertising?
Based on the data we have, it’s still too early to benchmark performance confidently. However, that doesn’t mean you should ignore it. It’s definitely worth testing, but do so cautiously as measurement methods for this space continue to develop.
How does LiftLab calculate its benchmarks?
LiftLab’s Marketing Science team produces these figures from CYTD 2026 results across all clients, using marketing mix modeling and incrementality testing. They aren’t from a third-party panel or a single client’s data. That methodology is what supports the benchmarks above.
The complete CY2026 Marketing Benchmark Report, and a CY2027 planning checklist, is available here