
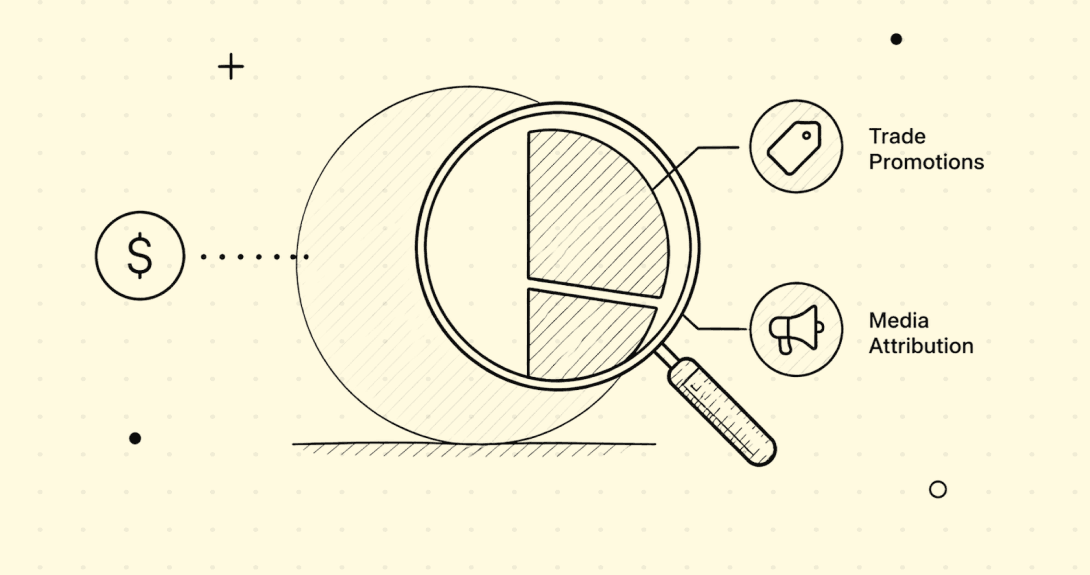
Every quarter, the same situation plays out across CPG and omnichannel retail. A brand runs a media campaign alongside a seasonal promotion, reports a strong ROAS, and sets that number as the new benchmark. The following quarter, without the promotion, performance drops and the media team is asked to explain a gap that was never a media problem to begin with. This post covers the mechanism, the financial cost, and the only measurement approach that resolves it cleanly.
Executive Summary
When a trade promotion and a media campaign run simultaneously, as is the case with most omnichannel brands, your attribution model cannot separate the two effects. This inability to tell them apart results in the model crediting the media with the lift the promotion drove, producing an inflated ROAS number that is neither accurate nor repeatable.
This post covers the mechanism behind trade promotion media ROAS inflation, the compounding cost it creates across budget cycles, and the only measurement method that cleanly separates the two effects: a Marketing Mix Model that treats trade as a first-class variable alongside media.
What You Will Learn
By the end of this post, you will understand:
Why attribution models are structurally unable to separate trade promotion lift from media lift, regardless of how sophisticated the platform
The four commercial scenarios where this distortion is most severe and where budget decisions built on contaminated signals cause the most damage
How Marketing Mix Modeling includes trade as an independent variable to produce a media-only ROAS that holds across promoted and non-promoted periods
The three diagnostic signs that your current ROAS benchmarks are promotion-contaminated
A practical starting point for separating the two effects that does not require a full measurement overhaul
Does Running a Trade Promotion Alongside a Media Campaign Inflate Your ROAS?
Yes, and the inflation is structural rather than incidental. Attribution models trace digital touchpoints but carry no variable for promotional discounts, so they credit the media with all lift including the share the price reduction drove. This produces a blended ROAS that is neither accurate nor repeatable, compounding into false benchmarks for each budget cycle. The sections below explain the mechanism and the fix.
Attribution vs. MMM: What Each Approach Actually Measures
| What It Is | What It Measures | Why It Falls Short | What To Measure Instead |
|---|---|---|---|
| Last-click attribution | The final digital touchpoint before a purchase | Credits the last ad regardless of whether the promotion, not the media, drove the conversion decision | Media-only ROAS coefficient from MMM decomposition |
| Multi-touch attribution (MTA) | Digital touchpoints across the user journey leading to purchase | Distributes credit across online interactions and carries no variable for trade promotions or price reductions | MMM with trade included as an independent variable |
| Platform-reported ROAS | Revenue divided by media spend within the platform’s own measurement window | Combines media lift and promotional lift into a single number with no mechanism to separate the two | Decomposed MMM output that isolates media contribution to sales |
| Blended ROAS (current state for most brands) | Total sales lift during a campaign period, promoted or otherwise | Captures demand from both promoted and non-promoted conditions and becomes a false benchmark for future planning | Media-only ROAS from a Marketing Mix Model that includes discount depth, timing, and retailer context as independent variables |
Each of the methods above fails at the same point: none can see the promotional variable, so none can report media performance without it.
Why Your Strongest ROAS Quarter Is Often a Budget Planning Trap
The strongest ROAS numbers of the year almost always coincide with the heaviest promotional periods, and that coincidence is the planning trap. Your Q4 marketing campaign is running alongside a seasonal promotion. The platform reports a whopping 4.2x ROAS, a significant jump over your average ROAS. Finance is happy with the number and immediately approves a larger Q1 budget. When Q1 launches without the promotion to back it up, ROAS dips down to 2.1x. The ultimate conundrum? The media team is now being asked to explain the 50% drop in performance that no one saw coming.
Here is what actually happened: The Q4 number was not a media success driven by the campaign nor was the Q1 number a media failure. Both were the result of a combined effect that no one separated before making the budget call. The promotion added demand tailwind to Q4. The media ran without promotion in Q1.
This is an all-too-familiar pattern that plays out in budget meetings every quarter across omnichannel retail, CPG, and any brand running promotional activity alongside paid media. What makes this inflated ROAS illusion dangerous is not the single misread, rather the fact that the 4.2x becomes the new benchmark. Finance expects it again and the media team is held to a number that they cannot measure up against.
So, what’s to be blamed here? Is it the attribution model? No. Attribution models work exactly as they should; they see revenue rise when the promotion and the media runs together and credit the media. They have no mechanism to see the promotion’s contribution to the combined ROAS being reported.
Why Attribution Cannot Separate These Two Effects
What Attribution Models Actually Measure
Attribution models trace the paths near the conversion touchpoints: ad impression, click, purchase. That is the problem they were built to solve, and they solve it reasonably well within those boundaries.
What they cannot measure are external demand factors, let’s say, a price cut or an in-store promotion. This is what makes trade promotion misattribution structural rather than incidental. When a consumer clicks an ad and purchases a product, the attribution model records: the ad caused purchase. The fact that the trade promotion may have tipped the scales in the ad’s favor remains invisible to the model.
The Concurrent Event Problem
Trade promotions and media campaigns almost never run in isolation from each other. In practice, promotional windows are chosen precisely because they align with high-traffic moments. The signals are structurally entangled before the media campaign even launches.
In fact, industry estimates suggest that in CPG categories up to 70% of total volume is sold during promotional periods. If most of your media runs when most of your promotions run, your media ROAS data is almost entirely plagued with media attribution contamination you have no way of separating.
The Feedback Loop This Creates
The contaminated ROAS number enters the next budget cycle as a benchmark. Future campaigns are evaluated against an inflated baseline making them appear to underperform relative to a standard they were never capable of replicating.
Over time, the brand’s media effectiveness measurement benchmarks drift further from reality, and every reallocation built on them compounds the error one quarter after another. One wrong number teaches the system the wrong lesson, and the system acts on that lesson every time.
The Scale of What This Is Costing You
The financial stakes here are larger than most brands account for. Approximately $500 billion is spent globally on CPG trade promotions annually. Industry consensus suggests that 35 to 40 percent of that spend is wasted, in part because the feedback loop between trade investment and media attribution has never been made visible. The two are managed separately and never asked to account for what they drove together versus independently. You cannot optimize what you cannot isolate.
What media ROAS inflation does at the channel level is equally damaging. When a platform gets credit for lift that a discount actually drove, budget migrates accordingly. Brands over-invest in channels the model rewarded for catching a promotional tailwind, moving budget from channels that were actually delivering efficient media returns during non-promotional periods. Budget reallocation is being built on a distorted signal.
Another consequence is brands falling into the repeatable performance trap. A campaign may have returned 4x during a promotion, but that doesn’t make it a 4x campaign. Presenting it to the board as a repeatable baseline is a consequence of the architectural limitation where promotional lift attribution blends into media reporting. When Q1 comes back at 2.1x, Finance concludes that the media team cannot accurately predict performance. This creates a dent on credibility that costs more than one budget cycle; it reshapes the entire CMO-CFO relationship for the next twelve months.
What the ROAS number implies:
The media campaign drove 4x return on spend. Budget should increase because the channel has proven it can deliver that outcome again under similar investment.
What it may actually reflect:
A combined effect of media reach and promotion shaped by media, promotion depth, timing, retailer context, and seasonal demand that drove trial, with no way of knowing the ratio between the two.
Four Scenarios Where This Distortion Is Most Severe
Trade promotion misattribution causes the most damage in four commercial scenarios that most omnichannel and CPG brands encounter regularly.
1. Seasonal Campaigns Running Alongside Promotional Windows
A brand that sets its media effectiveness standard from a Black Friday campaign ROAS is setting a benchmark it will spend the rest of the year failing to meet. Holiday, back-to-school, Black Friday, these are some moments when media budgets are at their highest, and promotional depth is at its greatest. They are also the moments when ROAS inconsistency is severe and likely to be extracted as annual benchmarks.
2. Retailer Co-Op Media That Requires Promotional Placement
Many co-op arrangements such as a featured listing or a sponsored position require a promotional offer for a media placement. The media and the promotion are commercially inseparable; one does not exist without the other. Attributing the resulting lift to the media alone happens when the model has no variable for the promotional condition that makes the placement possible.
3. New Market or Channel Launches With Introductory Pricing
When introductory pricing normalizes, performance declines and the media is blamed, even though the discount was the primary trial driver. The media is blamed, in reality, the discount was the primary trial driver, and the media ran on its tailwind without any model separating the two.
4. Performance Marketing During Category-Wide Promotional Events
When a retailer runs a category-wide event, irrespective of whether the brand initiated it, baseline demand rises across the shelf. A campaign active during that window captures organic promotion-driven sales lift and reports it as incremental media ROAS. When the promotion ends, the channel underdelivers against its own inflated benchmark, with no reasonable explanation that satisfies Finance.
What Clean Measurement Actually Requires
Clean separation of trade and media effects requires a model that was designed to see both simultaneously, not an upgraded attribution stack. Trade and media effects can only be separated if they are modelled together with independent variables. Any model that treats ROAS as a function of media spend alone, without factoring in promotional depth, timing, and retailer overlap, will always misallocate credit between the two.
Updating your attribution stack cannot isolate media effectiveness measurement. Attribution is the wrong tool for this problem. Isolation requires a model that was designed to see both effects simultaneously.
For a broader look at why attribution’s limits run deeper than trade contamination, Read The Measurement Waterline
What the model needs as inputs: A complete trade and promotion calendar covering dates, discount depths, retailer, and SKU-level data where available; media spend by channel and market for the same period; and POS-level sales data as the dependent variable
Why this cannot be done inside an attribution tool: Attribution operates at the user-journey level and has no mechanism to register promotional variables. The separation requires a marketing mix modelling trade promotions architecture that treats trade as a first-class variable alongside media spend, not as noise to filter out.
How Marketing Mix Modeling Separates Trade and Media Effects
How MMM Includes Trade as a Variable
A well-built marketing mix modelling trade promotions model does something attribution cannot: it separates media and trade using a promotional variable for every period in the dataset. Was a promotion running at the time? For which markets or channels? What was the discount depth? These variables sit in the model alongside media spend as independent variables that measure the contribution of the promotion to sales lift separately from media.
What does this do when a media campaign and promotion run at the same time? The model attributes the share of sales lift to the correct channels, rather than combining it into a single ROAS.
What Decomposition Looks Like in Practice
The result of this separation is sales decomposition. The model can now show what share of the sales lift was media-driven, what share was promotion-driven, and what share was baseline. One blended trade promotion media ROAS figure becomes two separate, trustworthy ones.
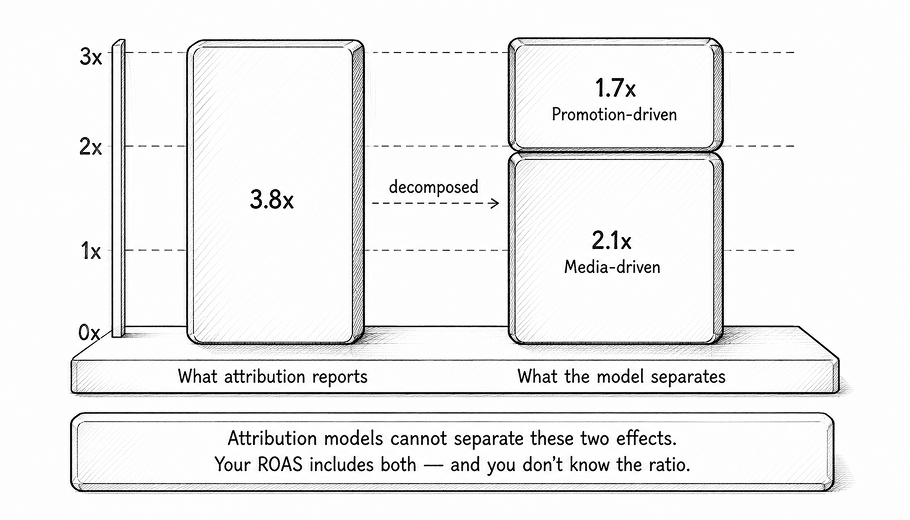
Here is what that decomposition looks like in practice.: You start a campaign during a 15% off promotion. Attribution reports a blended ROAS of 3.8x. After MMM decomposition, the media ROAS is 2.1x and the promotional contribution accounts for the remaining 1.7x. The media performed well but not at 3.8x which the attribution would have otherwise noted.
The difference between 3.8x and 2.1x stops being a mystery the moment a model can see both effects separately. This decomposition produces something more valuable: a media-only ROAS coefficient that works as a capital allocation signal making the next board presentation defensible and giving the CFO a credible number to build a budget plan on.
Why This Changes the Promotion Calendar Too
Clean separation does not just produce better numbers. It drives different decisions and consistently better ones.
When trade contribution is visible in isolation, the brand can evaluate promotional mechanics such as discount depths, durations, retailer co-op types, with the same rigor as media channels. Which promotions drive genuine trial vs. pantry loading? Where does promotional ROI hit diminishing returns? Only by separating the two does trade spend stop being a cost center and becomes an optimizable lever.
This changes the entire CMO-CFO dynamic as instead of defending media performance against an unrealistic benchmark, the CMO can now present both media and trade efficiency in the same view. And when the next planning cycle comes, the revenue forecast holds. Finance’s question moves on from “why didn’t you replicate Q4’s success?” to “where do we put the next dollar?”
LiftLab’s Agile MMM architecture treats trade and promotion as separate variables in the model rather than noise to be absorbed, because the real question is not just whether the promotion worked, but whether the media worked without it.
Find out how the online-to-offline attribution gap compounds media attribution contamination across your full measurement stack.
When trade ROI becomes visible in isolation, brands can also begin evaluating the longer-term brand effects of promotional mechanics separately from their short-term volume contribution.
Three Signs Your ROAS Has a Promotion Problem
1. Your strongest campaigns always coincide with promotional windows, and no one knows why. If top-quartile media ROAS consistently clusters around promoted periods and lower-quartile results fall in clean ones, the variable your model is missing is the promotion not media volatility.
2. Your media performance looks unpredictable, quarter over quarter. When similar budgets, channels, and creative produce widely different results, an uncontrolled trade calendar is frequently the underlying cause. What reads as ROAS inconsistency is usually promotional overlap changing the demand environment.
3. Your Q4 or peak season ROAS becomes your year-round benchmark. Peak periods typically carry the heaviest promotional activity. Using that ROAS as the standard for evaluating Q1 or Q2 campaigns sets a benchmark no clean-period campaign can structurally match. What looks like underperformance is the difference between a promoted environment and a clean one.
How to Start Separating Trade from Media Effects
The starting point is not a measurement overhaul, but a complete data audit.
Pull up your trade and promotion calendar for the last 24 months alongside your media spend. Ask how many weeks both ran simultaneously. For many omnichannel brands, the overlap between active trade promotions and live media campaigns exceeds the majority of calendar weeks. That overlap is how most current CPG media benchmarks were set.
The goal is a trade promotion attribution model that means the same thing every time; one Finance can audit; media team can plan from and does not collapse the moment the promotional environment changes.
What needs to be done? Bring both datasets into a single model. With independent variables for trade and media, decomposition is now possible. What was one untrustworthy number becomes two reliable ones. The next campaign forecast doesn’t rely on an inflated ROAS driven by trade promotion, rather it is built on what media independently drives. The board? You no longer need to explain the promotional calendar, thereby driving cleaner capital allocation decisions.
The Q4 result your finance team is benchmarking against was never a media success. It was demand success shaped by pricing, timing, and promotional mechanics that ran alongside your campaign and got absorbed into the ROAS. Separating those two effects, measuring them together, and reporting independently, is the difference between a ROAS that holds and one that needs explaining.
LiftLab and PMG’s guide to building measurement separates every demand driver cleanly. Read the full framework: Escaping the Omnichannel Measurement Trap
See how LiftLab separates trade and media effects:
Key Takeaways
Attribution cannot separate media-driven lift from promotion-driven lift
Up to 70% of CPG volume sells on promotion, contaminating most media data
Blended ROAS numbers compound into false benchmarks across every budget cycle
The contamination problem is not unique to CPG. Any brand running promotional events alongside paid media is exposed.
Clean decomposition produces a media-only ROAS that holds across promotional and non-promotional periods
Separated signals change the CMO-CFO conversation from credibility defense to confident planning decisions.
FAQs about Trade Promotions and Media
Why do trade promotions inflate media ROAS?
When a promotion and a media campaign run together, the reported trade promotion media ROAS is a combined effect. Attribution models trace digital touchpoints and have no variable for the promotional discount. The model credits the ad with the full lift including what the price reduction drove.
How do you separate trade and media effects in measurement?
Include both as independent variables in a Marketing Mix Model. The MMM estimates each contribution to sales separately and then decomposes the lift into media-driven and promotion-driven shares. The result is a media-only ROAS that holds across promoted and non-promoted periods alike.
What is trade promotion misattribution?
Trade promotion misattribution is when sales lift from a price reduction or promotional event is incorrectly credited to media running at the time. Attribution tools have no separate variables for the promotion. The blended output overstates media effectiveness measurement and understates trade contribution distorting the media plan and the trade calendar simultaneously.
What percentage of CPG volume is sold on promotion?
<a href=”https://softservebs.com/en/resources/trade-promotion-in-cpg/” rel=”noopener nofollow noreferrer”>Research</a> estimates up to 70% of CPG volume moves during promotional periods which means most historical media ROAS data for CPG brands was generated while a promotion was active. Without a model that controls for promotional depth, those estimates are contaminated by default.
Can Marketing Mix Modeling handle trade promotions?
Yes, it can. The ideal MMM for trade promotions includes discount depth, timing, and retailer variables as first-class inputs. The model then separately estimates the incremental contribution of the promotion and the media, thereby producing a media-only ROAS coefficient that is used to govern capital allocation decisions.
Why is ROAS inconsistent quarter over quarter?
Inconsistent ROAS is largely because any changes to the trade calendar are not captured by the measurement model. When promotions run in Q4 and not Q1, the blended ROAS changes. This is not because media performed differently, but because the promotional tailwind doesn’t exist anymore. Attribution reads this as ROAS inconsistency.
How does LiftLab separate trade promotion effects from media ROAS?
LiftLab’s Agile MMM treats trade promotions as independent variables in the model, including discount depth, timing, and retailer context, so the model estimates media contribution to sales separately from promotional contribution. The output is a media-only ROAS coefficient that holds regardless of whether a promotion is running, giving finance a reliable input for budget planning and giving the media team a number they can forecast from with confidence.