

Holiday ad spend stops being effective when a channel’s marginal ROAS (the return on the next dollar spent) drops below breakeven. With a 40% contribution margin, breakeven is 2.5x, meaning each new dollar needs to bring in $2.50 in extra revenue to cover its cost. In Q4, higher CPMs, more competition, and audience fatigue can push channels below breakeven faster, and average ROAS can make this hard to spot. Here’s how to identify that point and what to do about it.
Executive Summary
Q4 is when most of the money goes to the same customers. Costs rise across almost every channel, and average ROAS looks good even after the last dollars stop being profitable, since strong early returns offset weaker later ones. The best tools are a break-even rule, a way to read the performance curve, and a way to explain the trade-off to finance, since no single holiday saturation number exists.
What you will learn
Why holiday ad spend saturates faster than spend in any other quarter
The breakeven formula that tells you when the next dollar loses money
How to read a response curve for marginal ROAS instead of average ROAS
Why every saturation estimate should come with an uncertainty band
The criteria for trimming a saturated channel mid-flight
A trade-off frame finance can approve quickly
Why does a healthy holiday ROAS hide a losing next dollar?
A strong holiday ROAS can be misleading because the average ROAS includes all spending, even the most efficient early dollars. However, only the next dollar you spend determines if you actually make a profit.
The holiday plan looked fine in the spreadsheet. Paid social is running at a 3.4x blended ROAS, search is above target, and the team wants another 20% for Cyber Week because “it is working.”
Here is the problem nobody puts on the slide: That 3.4x is the average of every dollar spent so far. The first dollars in October found high-intent buyers at reasonable CPMs. The dollars going out the door in the second week of December are buying the same people a seventh impression at a far higher price. The average looks healthy. The next dollar might be losing money.
The gap between the average dollar and the next dollar is where holiday budget leaks out.
Where does holiday ad spend start losing money?
Holiday ad spend stops being profitable when a channel’s marginal ROAS drops below breakeven. To figure this out, compare the channel’s current marginal ROAS to 1 divided by your contribution margin. Since both numbers can change in Q4, review each channel separately rather than the whole account.
Why do Q4 returns fall faster than the rest of the year?
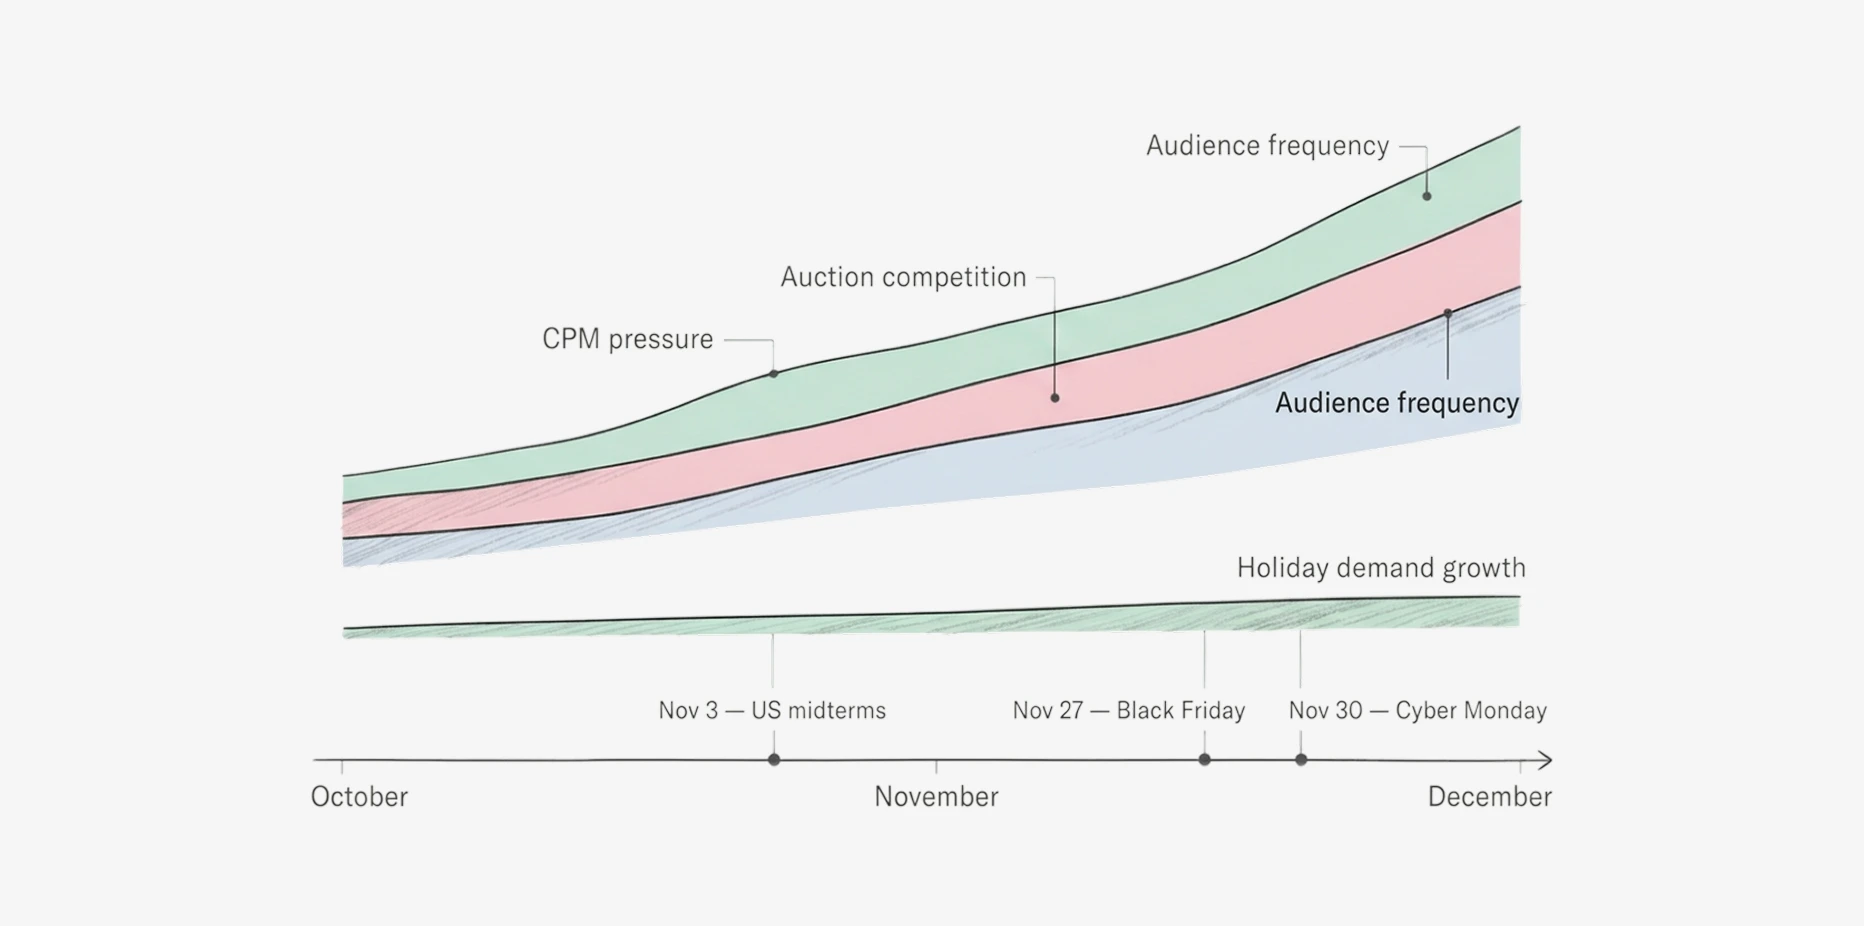
Q4 returns fall faster because three pressures stack in the same eight weeks, and each one bends the response curve earlier. None is a reason to stop spending. All are a reason to stop assuming September efficiency will hold in December.
| Q4 pressure | What it does to the next dollar | What to watch instead of average ROAS |
|---|---|---|
| Rising CPMs | Each impression costs more, so the same response costs more to buy | Cost per incremental conversion, week over week |
| Crowded auctions | Bids from retailers and political advertisers compete for the same inventory | Impression share and CPM by week against the same weeks last year |
| Audience fatigue | Repeat exposure to the same buyers adds cost without adding new demand | Frequency against conversion rate per segment |
| Average ROAS reporting | Strong early dollars mask weak late dollars | Marginal ROAS at current spend, with uncertainty bands |
Rising CPMs make the same response more expensive
If more advertisers compete for the same audience on the same days, prices go up. This means it costs more to reach the same customer, even though the customer hasn’t changed.
On a ROAS report, a channel that is only more expensive in Q4 looks less effective. If your model cannot separate a cost change from a response change, it will misread where saturation starts, and a pricing problem gets treated as an audience problem.
Crowded auctions bring in advertisers you do not normally compete with
Q4 2026 will be even more competitive. The US midterm elections are set for November 3, 2026, and AdImpact expects political ad spending to hit a record $11.6 billion this cycle. About $5.6 billion will go to broadcast, and $2.7 billion to connected TV. Brands that rarely compete with each other end up in the same auctions, and the clearing price rises for everyone. Political bidding drops after November 3, apart from any runoff races, so a late-October CPM jump does not by itself predict Cyber Week pricing.
Meanwhile, the demand being chased is growing more slowly. EMARKETER’s Holiday Shopping 2026 report forecasts that US retail sales for November and December 2026 will grow 4.1%, the second consecutive year that holiday growth trails the full-year average. If holiday ad budgets hold while demand grows more slowly than the rest of the year, each extra dollar chases less new demand.
Audience fatigue adds frequency without adding customers
The most responsive customers convert early. After that, extra spend in the same audience pool buys frequency: the same people seeing the ad for the fifth, sixth, or seventh time. Each repeat exposure costs as much as the first and moves fewer people.
Creativity fatigues too. A single hero creative running from early November through December loses response well before the season ends, at full price.
How do you estimate your saturation range?
You estimate a saturation range by modeling a response curve for each channel, reading the marginal ROAS at your current spend, and comparing it to your breakeven. The output is a range with an uncertainty band. Anyone who promises one exact number for your holiday ceiling is selling false precision.
Start with a response curve
A response curve plots incremental revenue against spend for one channel. It rises steeply at low spend, then flattens as each extra dollar reaches less responsive buyers. Saturation is the zone where the curve is nearly flat.
The curve must account for seasonality, promotions, pricing, and base demand. Without those inputs, the Black Friday spike gets credited to whatever media ran that week, and the curve looks steeper than it is.
Separate marginal ROAS from average ROAS
Average ROAS divides total revenue by total spend. Marginal ROAS divides the extra revenue from the next block of spend by the cost of that block. In Q4, the two separate fast, because every channel hits diminishing marginal returns sooner.
The illustrative example below assumes a channel with a 40% contribution margin, meaning 40 cents of each incremental revenue dollar remains after variable costs, which sets breakeven marginal ROAS at 2.5x. The figures are hypothetical and exist only to show the math.
| Spend tier | Incremental revenue from this tier | Marginal ROAS | Cumulative average ROAS | Margin gained or lost on this tier |
|---|---|---|---|---|
| First $600,000 | $2,400,000 | 4.0x | 4.0x | +$360,000 |
| $600,000 to $800,000 | $600,000 | 3.0x | 3.8x | +$40,000 |
| $800,000 to $1,000,000 | $440,000 | 2.2x | 3.4x | −$24,000 |
| $1,000,000 to $1,200,000 | $260,000 | 1.3x | 3.1x | −$96,000 |
| $1,200,000 to $1,400,000 | $120,000 | 0.6x | 2.7x | −$152,000 |
With $1.4 million spent, the average ROAS is 2.7x, which is above the 2.5x breakeven. Based on averages, a report would say this channel looks healthy. However, the last $600,000 actually lost $272,000 in margin. This is the kind of problem that average ROAS misses.
Report uncertainty bands
Every response curve is an estimate. The flat part, where saturation lives, has the least data, because few weeks in a brand’s history reach those spend levels. The saturation point is the least certain part of the curve.
Report it as a range: “Marginal ROAS crosses breakeven somewhere between $820,000 and $1 million, with the central estimate near $900,000.” A range tells finance how much risk sits in the decision. A single figure hides it.
Narrow the band with an experiment
When the band is too wide to act on, test it. A geo experiment that runs higher spend in some markets and holds spend steady in matched markets measures the response at the spend level you are debating. Pacing tests that deliberately step spend up and down trace the shape of the curve directly. Run them before peak week, not during it, so the result arrives in time to change the plan.
If there is no time to test before peak week, hold those channels at current spend and revisit once the season ends.
How do you move in-flight holiday dollars?
You move in-flight dollars by trimming channels whose marginal ROAS sits below breakeven, redirecting that budget to channels with headroom on their curves, and documenting the trade-off before the move. Done well, holiday ad spend optimization shifts a fraction of budget in steps and checks the result each week.
Criteria for trimming a saturated channel
A channel only qualifies for a trim when the whole uncertainty band sits below breakeven. If the band straddles it, hold and test. Locked commitments such as TV upfronts or retailer co-op agreements come off the table before any scenario runs.
| Signal | Trim | Hold | Add |
|---|---|---|---|
| Marginal ROAS against breakeven | Below breakeven across the whole uncertainty band | Band straddles breakeven | Above breakeven across the whole band |
| Cost per incremental conversion | Rising for two or more weeks | Stable | Falling or stable as spend rises |
| Frequency against conversion rate | Frequency rising, conversion falling | Both stable | Frequency low, conversion holding |
| Commercial constraints | No locked commitments | Partly committed | Inventory available at current pricing |
Where to redirect the dollars
Redirect to channels where marginal ROAS at current spend sits clearly above breakeven, not to the highest average ROAS. A high-average channel is already saturated when its next dollar falls below breakeven, while a smaller channel on the steep part of its curve still has headroom.
Timing matters as much as destination. Shifting dollars across weeks, toward the days when auction pressure in your category is lower, can buy the same response for less inside the same channel. Hold a reserve for the final push before shipping cutoffs.
A CFO-ready trade-off frame
Finance does not need the model. It needs the decision, the downside, and the trigger to reverse it.
| What finance asks | What to show |
|---|---|
| What are we moving? | Dollar amount, source channel, destination channel, dates |
| Why now? | Marginal ROAS of the source against breakeven, with the uncertainty band |
| What do we expect? | Incremental revenue and margin range from the move |
| What is the downside? | Revenue at risk if the source channel was not saturated |
| How will we know? | The metric checked weekly and the threshold that reverses the move |
According to Gartner’s 2026 CMO Spend Survey, which included 401 CMOs and marketing leaders from companies mostly earning over $1 billion, marketing budgets now account for 7.8% of company revenue. This is just slightly higher than the 7.7% reported in 2025. The survey also found that 56% of CMOs feel they lack enough budget to achieve their 2026 goals. With budgets staying flat, shifting holiday marketing spend from crowded channels is one of the few ways to find extra resources.
LiftLab’s Scenario Planner includes this approach in the planning process. Scenarios use modeled response curves, and you set commercial constraints from the start. This way, every recommendation is practical for your team. Find out how it helps CFOs.
Key Takeaways
The next dollar decides holiday profit. Read marginal ROAS, since blended ROAS averages in every efficient early dollar.
Breakeven marginal ROAS equals 1 divided by contribution margin. Know that number before the season starts.
Q4 cost pressure and falling response look the same on a ROAS report. Separate them before you cut.
Saturation is a range. Report it with an uncertainty band and narrow it with experiments run before peak week.
Trim only when the whole band sits below breakeven, and redirect to channels with headroom on their curves.
Present every move with its downside and its reversal trigger.
Frequently asked questions about holiday ad spend
What is a saturation curve in advertising?
A response curve shows how incremental revenue changes as spend on one channel rises. It climbs steeply at first, then flattens as additional spend reaches less responsive buyers or repeats exposure to the same ones. The flat zone is saturation, where diminishing returns set in and each extra dollar adds little.
What is marginal ROAS?
Marginal ROAS is the incremental revenue generated by the next block of spend divided by the cost of that block. It differs from average ROAS, which divides total revenue by total spend. Average ROAS reflects all past dollars, including the efficient early ones. Marginal ROAS shows what the next dollar will return, which makes it the right metric for deciding whether to add or cut budget.
How often should I recheck saturation during the holiday season?
Recheck saturation weekly from early November through the end of December. During Cyber Week, watch platform signals daily and re-estimate the curve weekly, because daily data on the flat part of the curve is thin. CPMs, competition, and creative fatigue shift faster in Q4 than in any other quarter, so a curve fitted in September is out of date by Thanksgiving. Pair each check with a predefined threshold, so a breach triggers a decision instead of a discussion.
What is breakeven ROAS, and how do you calculate it?
Breakeven ROAS is the return level at which each ad dollar precisely pays for itself. It can be calculated by dividing 1 by your contribution margin; for example, if the margin is 40% then the breakeven point is 2.5 times. You should apply this breakeven figure to the marginal ROAS, that is, the return produced by the following amount of spending, since the average ROAS may be above breakeven even though the last dollars are making a loss.
Why do ad returns fall on Black Friday and Cyber Monday?
Returns per dollar tend to drop during peak weeks since CPMs go up, more advertisers are competing for the same shoppers, and the dashboards give credit to ads for purchases that would have been made anyway due to the holiday demand and the discounts. Instead, look at the marginal return rather than the dashboard average and carry out any test before the peak week.
How does LiftLab’s Agile MMM update curves as platforms shift?
LiftLab’s <a href=”https://liftlab.com/platform/agile-marketing-mix-modeling/”>Agile MMM </a>separates auction cost effects from consumer response, so rising Q4 CPMs are not misread as falling effectiveness. <a href=”https://liftlab.com/platform/real-time-mmm-intelligence/”>PlatformSense</a> applies daily platform signals such as click-through rate, conversion rate, and impression share as bounded modifiers on long-horizon response curves built on one to three years of data. The Incrementality Testing Suite narrows uncertainty where it is widest, and the Scenario Planner turns updated curves into constraint-aware reallocation options.
Take the next step
This article covered why holiday ad spend saturates early, how to find the breakeven point on each curve, and how to move in-flight dollars with a frame finance can sign off on. What most teams still need is the operating model that connects those curves to budget decisions every week, not once a quarter. Download the whitepaper From Measurement to Capital Allocation to see how response curves, experiments, and scenario planning work together to set budget with finance.