What you will learn
Why ROAS systematically shifts the budget toward channels that capture demand and away from those that generate it?
Five diagnostic signals that indicate Visibility Bias is already reflected in your P&L, and how to identify them before the next planning cycle.
Why does improving the MMM model alone not resolve the issue, and how does a closed-loop measurement system offer a different approach?
Your ROAS dashboard shows positive results, yet blended CAC rises, and brand investment declines each quarter. This article exposes the structural causes of this trend and demonstrates how leadership routinely overlooks the most costly measurement failures.
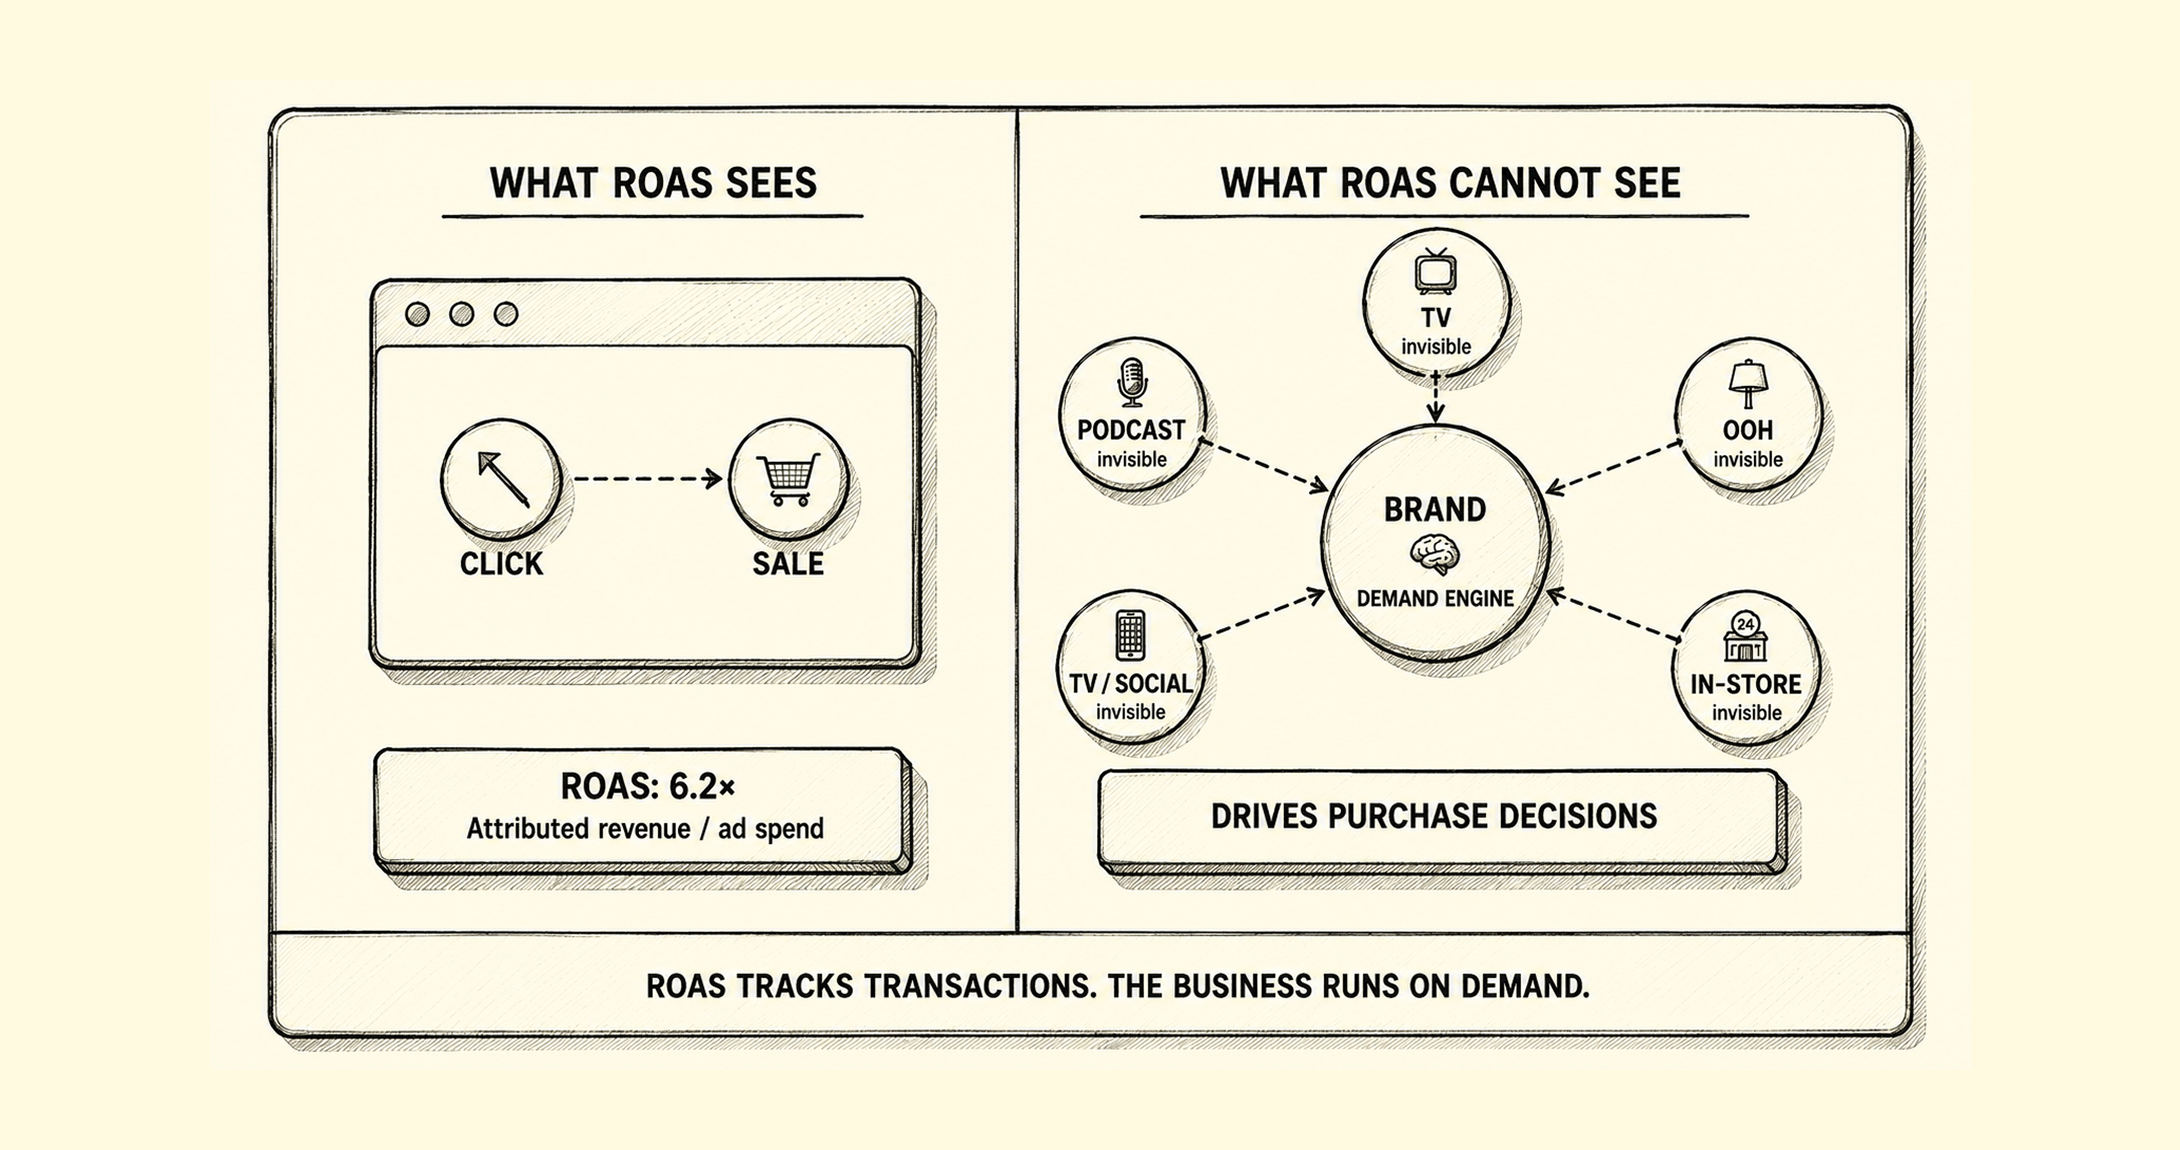
ROAS answers, “What did the ad cost per sale?”
It was never built to answer, “Did the ad cause the sale?”
The gap between metric measurement and true business growth compounds each quarter. At LiftLab, we call this Visibility Bias. By the time it shows up on a dashboard, it has shaped multiple budget decisions.
How ROAS Bias Skews Marketing Budget Allocation
The patterns are different. The direction is not.
The metric your CFO trusts was built for an era when ads, clicks, and purchases happened on one platform. Binet and Field’s IPA Databank analysis shows that three years of brand investment yields double the profit compared to short-term activation. As a result, brand budgets are cut each quarter based on justifiable evidence.
If the window closes before a brand matures, what does the review conclude?
By 2026, AI-driven bidding will significantly worsen this problem. Performance Max and Meta Advantage+ aggressively optimize for measurable signals: lower-funnel conversions, branded searches, and retargeting, while consistently neglecting demand creation. These algorithms intensify Visibility Bias, systematically redirecting budgets to what metrics reward and disregarding what the business demands for growth.
Visibility Bias — What It Is and Why LiftLab Named It
“Visibility Bias occurs when a closed-loop metric governs an open-loop system, systematically steering budget toward what can be measured and away from what drives growth.”
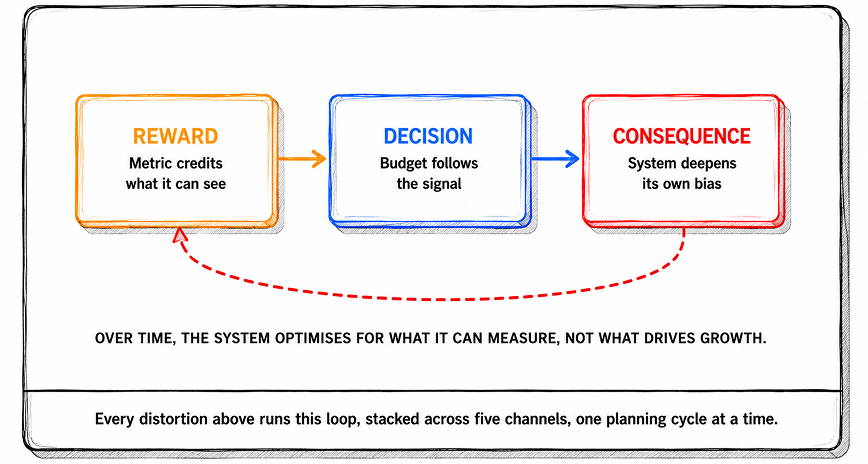
At LiftLab, Visibility Bias refers to a structural flaw that most measurement systems detect but cannot fix. This is not a data quality concern or a result of poor strategy. It occurs when metrics reward only what they measure, reshaping budgets over repeated cycles.
“ROAS is not wrong. It is biased, and the bias has a direction. Every quarter, the same direction. Toward what the system can see. Away from what actually drives the business.”
Why Visibility Bias Reshapes Marketing Systems
Visibility Bias does not just distort measurement. It systematically reshapes how the entire marketing system is built.
Every distortion above runs the same loop, stacked across five channels, one planning cycle at a time. Geo lift experiments improve the read on one channel. They do not correct the direction of the system allocating the entire portfolio. Full-funnel MMM does not escape it. Train the model on budgets shaped by Visibility Bias, and it produces a more precise version of the same wrong answer.
“A more precise instrument, run inside a biased system, produces a more precise version of the same wrong answer.”
If the model learned from a biased portfolio, what exactly has it been trained to optimise?
“The most expensive measurement failure is never the one leadership can see. It’s the one leadership is confident does not exist.”
85% confident. 32% measuring holistically. The gap is already priced into your decisions — and it is sitting in your P&L.
The Performance Paradox: Five Signals Your Dashboard Won’t Surface
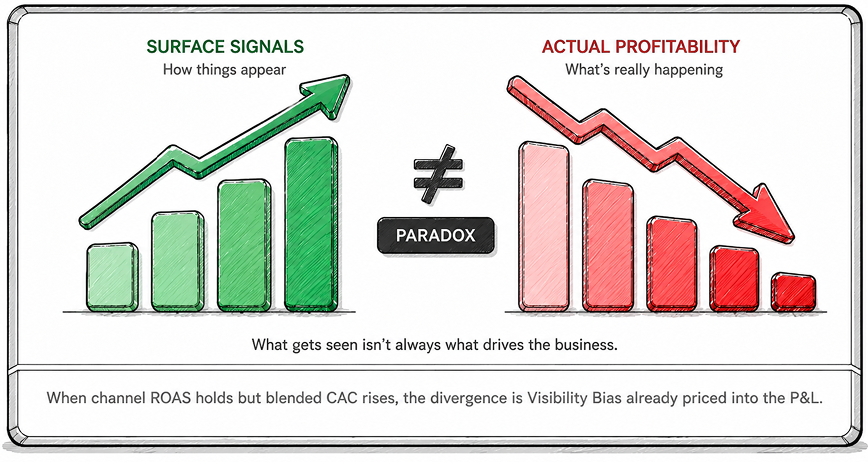
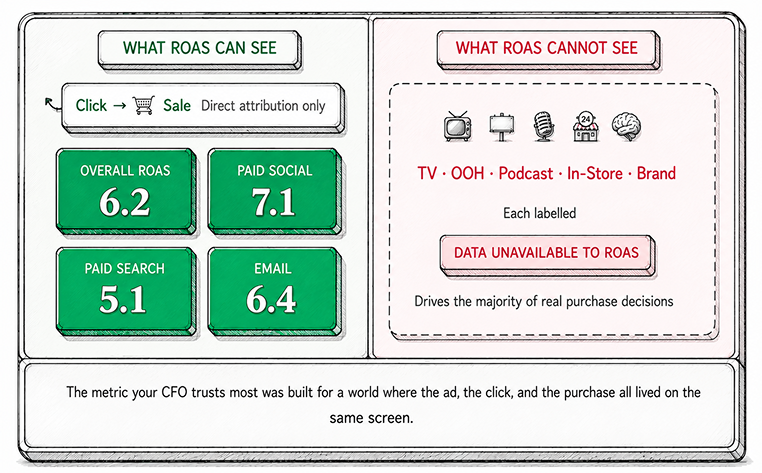
| Signal 01 | Channel ROAS is holding. Blended CAC is not. |
|---|---|
| What you see | Channel ROAS stable or improving across quarters while blended CAC rises across the same window. |
| Measurement issue | ROAS is channel-level; CAC is portfolio-level. The channel view cannot detect demand-pool depletion. Individual channels harvest better; the system that creates demand is being defunded. |
| What it tells you | By the time the divergence shows up on a dashboard, four quarters of misallocation are already in the budget. New customer volume is declining before anyone flags it as a measurement problem. |
| What to do | Compare channel ROAS over four quarters with total new customer volume. If improved lower-funnel efficiency coincides with flat or falling new customer volume, Visibility Bias is affecting your budget. LiftLab’s full-funnel model uniquely tracks both transaction signals and demand within a single model, calibrated to actual outcomes rather than platform reports. Key benefits include measuring sales alongside demand, connecting performance to business goals, and providing visibility beyond platform data. |
| Signal 02 | Every top-performing channel is a harvester. |
|---|---|
| What you see | Branded search, retargeting, and lower-funnel channels consistently top the ROAS leaderboard. Demand-creation channels rank last. |
| Measurement issue | Harvester channels claim credit for demand that upper-funnel investment created. ROAS cannot distinguish between capturing existing demand and creating new demand. The leaderboard rewards the last click before purchase, not the touchpoints that produced purchase intent. |
| What it tells you | When acquisition costs rise, returns fall, and growth stalls simultaneously, that is not three issues. It is one: the demand-creation pipeline has been systematically defunded by a metric that only sees the harvest. The gap between those two numbers is Visibility Bias, already priced into the P&L. |
| What to do | Run a geo holdout on your top ROAS channel, then compare the lift observed directly to the self-reported attribution. Channels with high ROAS but low incremental lift serve as harvesters, not drivers. LiftLab’s Agile MMM separates these effects: it quantifies halo, brand carryover, and demand-generation impact in one model used for budget recommendations. |
| Signal 03 | Brand investment keeps losing the budget conversation. |
|---|---|
| What you see | Upper-funnel and brand-building spend is the first cut in every planning cycle. The justification: it doesn’t show up in the ROAS report. Performance channels, which do show up, retain or grow their allocation. |
| Measurement issue | Brand effects build across quarters, while the ROAS window lasts weeks. During this period, brand investment can seem to underperform because its effects aren’t visible at the decision-making level. If the window closes before brand growth matures, reviews may misjudge success. |
| What it tells you | Binet and Field’s study in IPA’s Databank confirms that long-term brand investment provides double the profit of short-term activation. Despite this, brand budgets are slashed quarter after quarter, all supported by evidence that the system can write, because it’s measuring the wrong window. |
| What to do | Model brand contribution with an adstock decay window to capture long-term effects. LiftLab’s full-funnel MMM measures halo and brand effects in the same planning model as performance channels, ensuring unified results. Brand investment aligns with paid search evidential standards and uses CFO-friendly language. LiftLab is built to solve Visibility Bias at its source — not by measuring more of what ROAS already sees, but by modelling the demand system that ROAS has never had access to. The Agile Marketing Mix Model separates two signals that ROAS conflates: auction dynamics (CPM shifts, platform algorithm changes, AI-bidding redistribution) from genuine consumer response to the brand. This separation is what allows the model to measure TV halo, in-store conversion lift, and brand equity compounding alongside paid digital — in the same model, on the same time horizon, calibrated to actual business outcomes. |
One Signal Before Your Next Planning Review
Visibility Bias does not announce itself. It moves quietly, in the same direction, every planning cycle. It does not need to announce itself because the dashboard keeps confirming it.
One quarter, the drift is invisible. One year, it is survivable. Three years in, it is why CAC keeps climbing while every individual dashboard still reads green. Nobody flagged it because nothing looked broken.
The Self-Diagnostic — Run This Before Your Next Planning Cycle
Pull four quarters of channel-level ROAS against total revenue. If lower-funnel efficiency rose while overall growth stayed flat, the bias is already in your numbers. Specifically: compare branded search ROAS against new customer volume over the same window. If one is rising while the other is flat or declining, you are harvesting an existing demand pool, not building a new one.
ROAS was built for a system your business outgrew. It gave you a number every quarter. It never told you whether that sale would have happened anyway.
LiftLab — How We Solve Visibility Bias at Its Source
Measuring what ROAS cannot see — at the speed decisions happen.
LiftLab tackles Visibility Bias at its core, not by expanding what ROAS observes, but by modeling the demand system ROAS overlooks. The Agile MMM distinguishes auction shifts (CPM changes, algorithm updates, AI bidding) from actual consumer response. This lets the model measure TV halo, in-store conversion lift, and brand equity alongside digital, on the same timeline and calibrated to business outcomes.
AI-bidding platforms like Performance Max and Advantage+ accelerate Visibility Bias by instantly optimizing for measurable signals. LiftLab’s PlatformSense tracks daily auction dynamics and budget shifts. When platforms deepen bias, automatically reallocate to lower-funnel channels, or contaminate geo tests by redirecting spend, PlatformSense flags these changes before they corrupt the next planning cycle. Accurate inputs yield reliable model coefficients, enabling CFO-accepted budget recommendations.
The Trust Engine creates a closed loop: every completed geo experiment feeds its causal results into the AMM, updating response curves and saturation limits. The model improves with each experiment. Future budget advice is based on cumulative evidence, not manual reports or previously biased data.
Key Takeaways
ROAS shows attribution, not causation, and the gap between them is already reflected in your P&L, confirmed each quarter by the dashboard that shaped it.
Most advertising impact occurs outside tracked channels. TV, out-of-home, brand equity, podcasts, and in-store conversions are invisible to ROAS and are routinely underfunded.
ROAS consistently overvalues lower-funnel harvesters; in 2026, AI-bidding platforms like PMax and Advantage+ will further intensify this bias, automatically and without human input.
A more precise model, trained on biased budgets, delivers a more accurate version of the same flawed answer. MMM does not escape Visibility Bias by better modeling outputs; it needs experimental calibration of inputs.
Incrementality testing reveals the actual channel impact, but only when experiment results are integrated into the model rather than reported separately. Lift evidence to intelligence by closing the loop.
Frequently Asked Questions
Why is ROAS misleading?
ROAS measures only what attribution can track, such as last-click conversions from visible digital channels. It does not account for TV, out-of-home, podcasts, brand equity, or in-store impact. As a result, channels that capture existing demand consistently outperform those that create new demand. Over time, budgets shift toward what ROAS rewards, rather than what drives business growth. The metric itself is not flawed, but it is being used for portfolio-level decisions for which it was never intended.
What is Visibility Bias?
Visibility Bias, as defined by LiftLab, occurs when a metric rewards only what it can measure, gradually influencing budget allocation. Channels that generate trackable clicks receive funding, while those that build underlying demand are reduced. This bias compounds over planning cycles, as each quarter’s budget is shaped by the distorted data from the previous quarter. Eventually, blended CAC increases and new customer growth slows, even though dashboards may still appear healthy.
What percentage of ad impact happens offline?
There is no universal percentage that applies to all brands, categories, or channel mixes, and any vendor claiming otherwise should be viewed skeptically. Binet and Field’s IPA Databank research shows that brand-building investments generate profit effects that compound over 18 to 36 months, well beyond what a 30-day attribution window can capture. For most omnichannel brands, the portion of impact that is invisible to ROAS is significant and accounts for the majority of long-term revenue growth.
If ROAS is biased, do we stop using it?
No, do not stop using ROAS entirely. Instead, stop relying on it as the primary signal for channel budget allocation. ROAS is a valid measure of transaction efficiency for individual digital campaigns within a specific tracking window. The issue arises when it is used to determine channel funding or justify brand investment, as these decisions require insight into demand creation, offline impact, and compounding returns that ROAS cannot provide. Use ROAS alongside marginal ROI and full-funnel measurement to restore its value.
Does full-funnel MMM solve Visibility Bias?
Full-funnel MMM addresses the visibility issue but does not automatically resolve the bias. If an MMM model is trained on data shaped by years of ROAS-driven decisions, it learns from a biased history and produces more precise estimates of a misallocated budget, rather than correcting it. Addressing Visibility Bias requires ongoing causal experimental evidence to update channel coefficients based on actual incrementality results, not inherited distortions. This closed feedback loop, rather than the model alone, corrects the bias at its source.
What is the difference between ROAS and iROAS?
ROAS measures attributed revenue per dollar spent, counting every conversion the platform can track and crediting it to the last-click channel. iROAS measures only the revenue that would not have occurred without advertising, determined through controlled experiments comparing exposed and unexposed markets. For example, a branded search campaign may report a ROAS of 8x while its iROAS is near zero, since most users would have converted organically. iROAS provides a more accurate signal for budget allocation, indicating whether the spend created value rather than just capturing it.