- Platform
- Solutions
- Resources
- About
Stop optimizing for average ROAS. Pinpoint exactly where your channel returns flatten to prevent scaling into CAC spikes and confidently shift budget to your highest-yield opportunities.

Basic attribution dashboards treat all spend equally. Because average ROAS stays "healthy" even while your incremental returns collapse, teams often fall into the trap of blindly scaling their "top channels."
By the time average ROAS finally drops, you have already wasted thousands of dollars in the saturated, flat part of the curve. You need to stop asking "What was our average ROAS?" and start asking "What will our next dollar yield?"
ROAS often looks best in channels that capture existing demand, and it can stay “healthy” even while incremental returns collapse. That’s how teams end up overspending in the same places, because the metric doesn’t show when you’ve hit the flat part of the curve.
Scaling the “winner” without checking marginal returns
Cutting brand to “protect ROAS” (then demand thins out later)
Treating platform attribution as incrementality
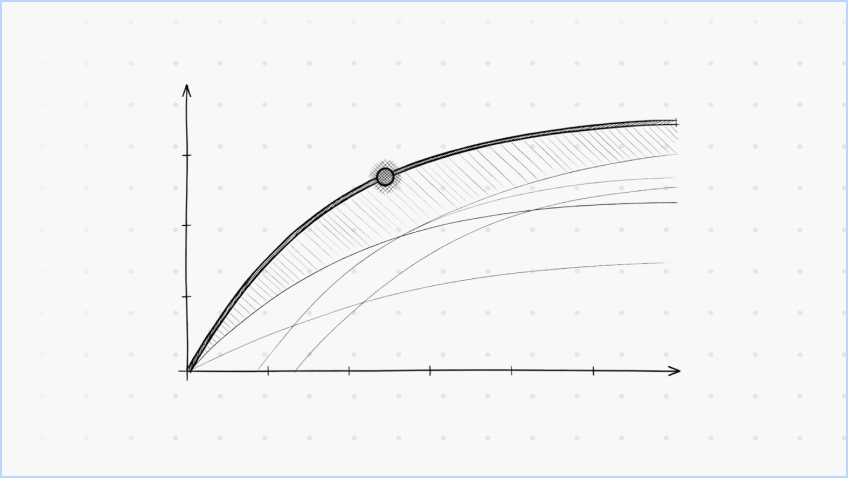
We separate ad auction dynamics from consumer response to plot highly accurate diminishing returns curves for every channel.
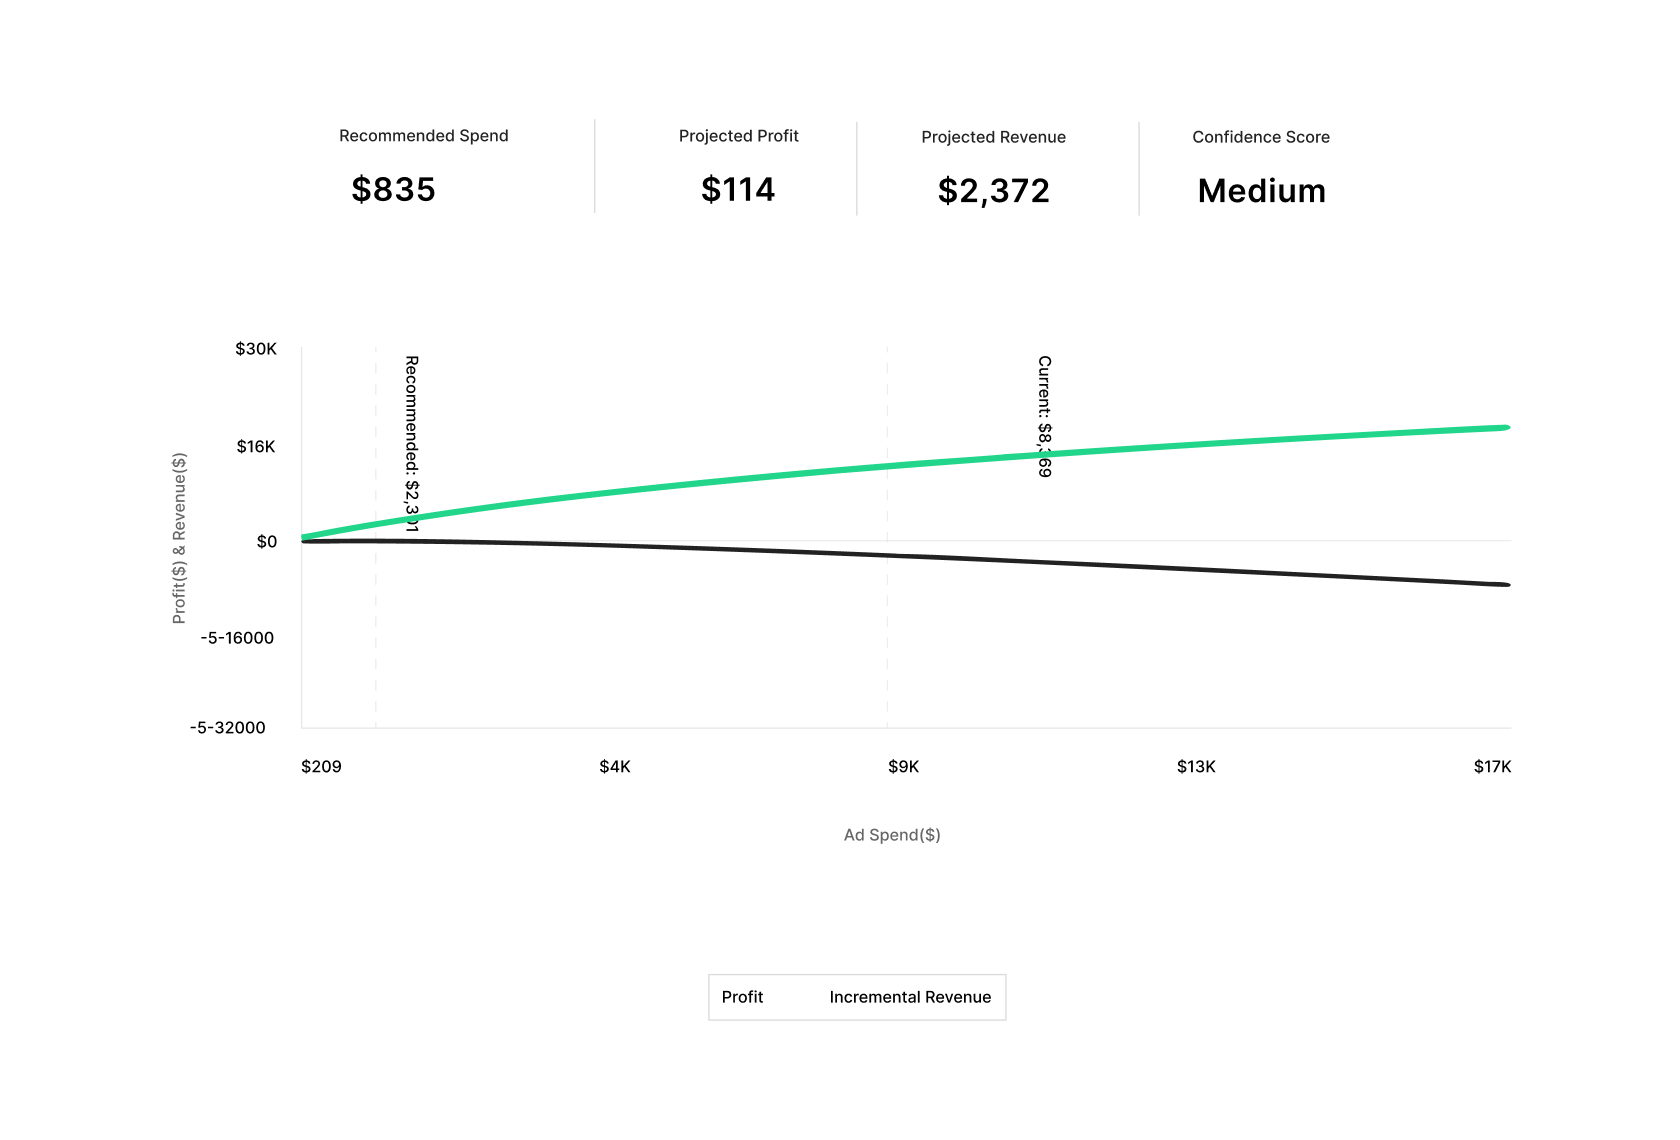
Visually identify exactly where a channel hits a wall. Calculate your true Marginal ROI (mROAS) at your current spend level to see what scaling will actually cost you.
Get mathematical directives (e.g., "Shift 10% from Paid Search to Retail Media") to maximize profit, backed by stop-loss triggers that protect you from overcorrecting.
Response Curves & Saturation
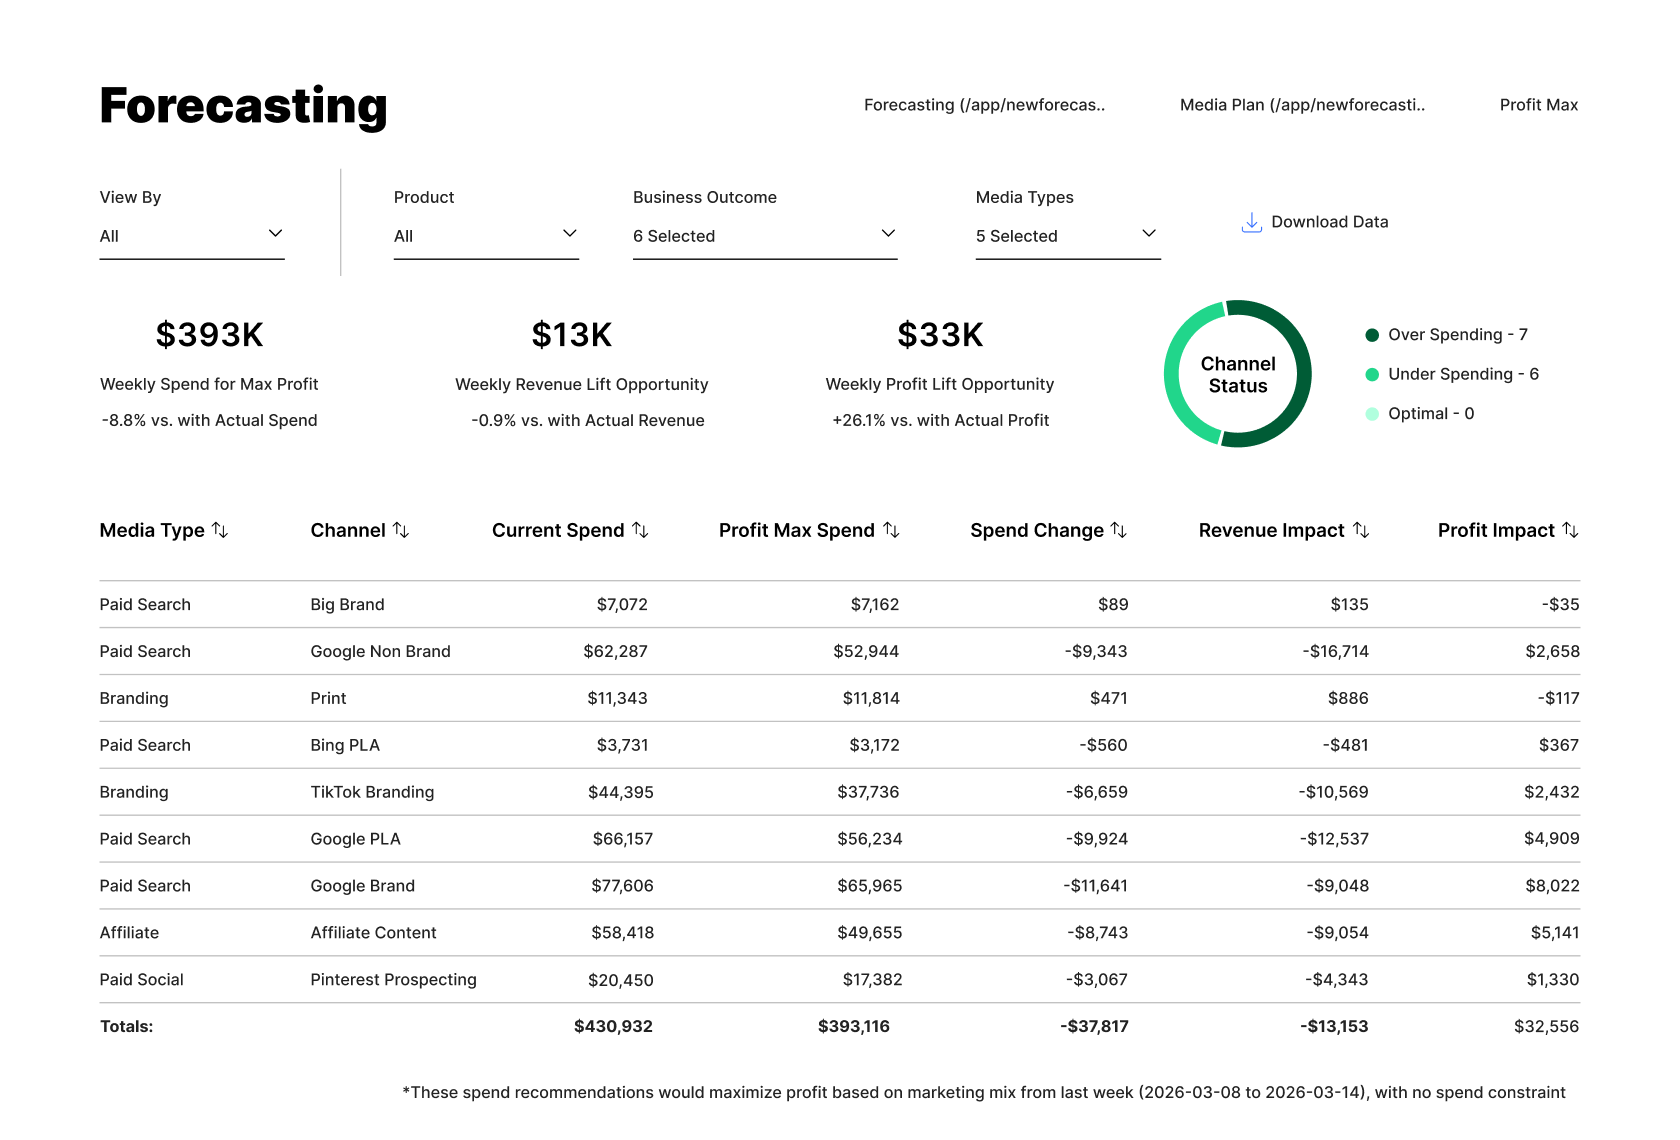
Reallocate With Guardrails
Marginal ROI at Current Spend
Start small. One move, one monitoring plan.